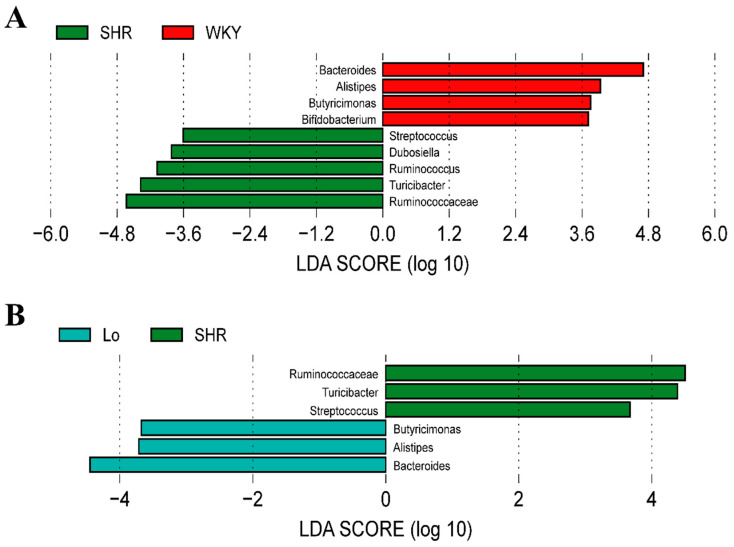
Figure 7.
The histogram of the linear discriminant analysis (LDA) value distribution at genus level of gut microbiota, which was used to find biomarkers with statistical differences. (A) Bacterial genera with significant difference in abundance between WKY and SHR groups. (B) Bacterial genera with significant difference in abundance between SHR-losartan and SHR groups.

