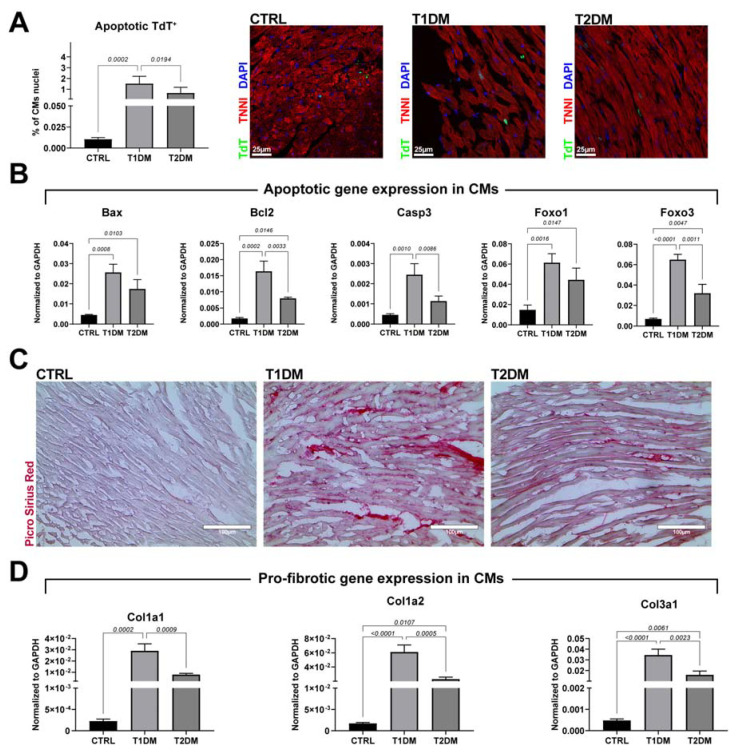
Figure 3.
STZ-based T1DM and T2DM mouse models differed in accumulation of reactive interstitial fibrosis in the left ventricular myocardium. (A) Bar graph and representative confocal images of apoptotic TdT (green)-positive cardiomyocyte nuclei in T1DM and T2DM mice compared to CTRL mice. Scale bar = 25 µm. (CTRL, n = 7; T1DM, n = 8; T2DM, n = 9.) (B) Bar graphs showing the expressions of apoptotic genes in cardiomyocytes isolated from CTRL, T1DM and T2DM mice (n = 3). (C) Representative light microscopy of Picrosirius red staining of T1DM and T2DM mice compared to CTRL mice. Scale bar = 100 µm. (CTRL, n = 7; T1DM, n = 8; T2DM, n = 9.) (D) Bar graphs showing the expressions of profibrotic genes in cardiomyocytes isolated from CTRL, T1DM and T2DM mice (n = 3). Data are mean ± SD.

