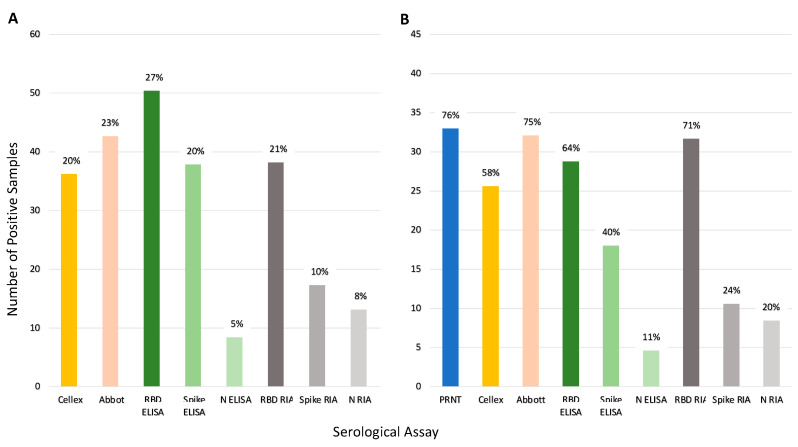
Figure 5.
Comparison of seroprevalence predicted by each serologic assay tested. Percentages represent positive samples by each assay. Panel (A) shows total percentage of positive samples (n = 186). Panel (B) shows the percentage of positive samples for the samples run on PRNT (n = 45). Note: Of the 45 samples only 44 samples were run on Abbot. One was not classified resulting in 33 out of 44 samples being positive (75%).

