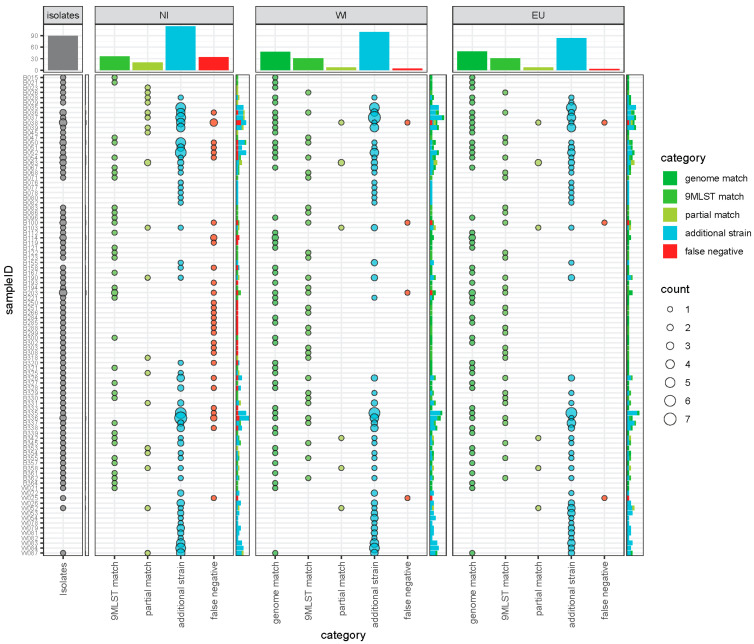
Figure 3.
Overview of predicted 9MLST profiles compared to isolated strains according to categories of matches (Supplementary Data S4). Panels are separated according to the utilized database (NI: without isolates from this study, WI: including isolates from this study, EU: including isolates from this study and only reference genomes from Europe) with a separate panel highlighting the number of recovered isolates on the left. Sample identifiers starting with B represent wild bird samples and W stands for surface water samples. Point size indicates the number of strains assigned to each category.

