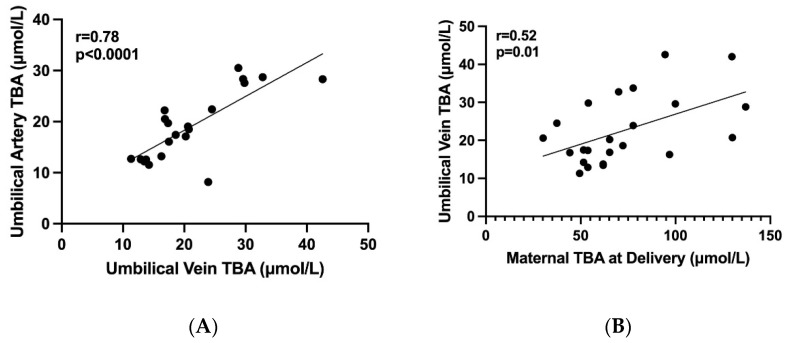
Figure 2.
The correlations between maternal and fetal TBA levels. Graphic diagrams which show the correlations between maternal and fetal TBA levels. (A) A positive correlation between TBA levels in umbilical artery and vein (r = 0.78, p < 0.0001), (B) A positive correlation between TBA levels in maternal serum at delivery and umbilical vein (r = 0.52, p = 0.01), TBA—total bile acids in μmol/L.

