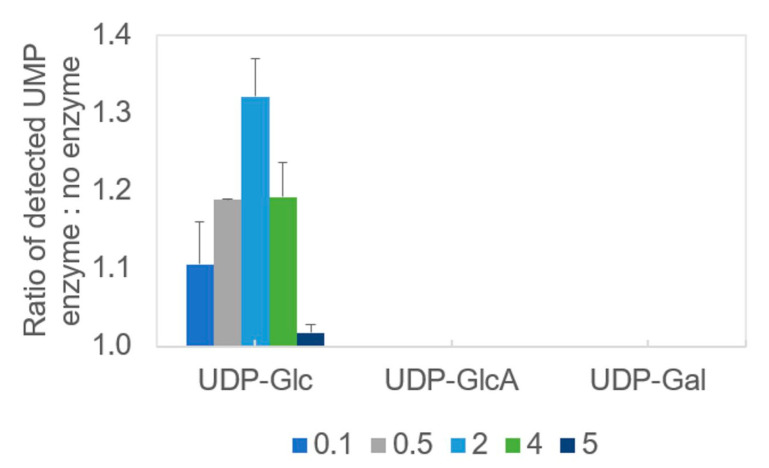
Figure 4.
Determination of the donor specificity of recombinant PssA phosphoglycosyltransferase. The colored bars represent the averaged results of two replicates for a given protein amount indicated in the legend at the bottom (μg), for which the ratio of the UMP detected in the complete reaction to the respective negative control (no enzyme) was calculated—thus the X-axis intersects the Y-axis at 1.0. Error bars represent standard deviation.

