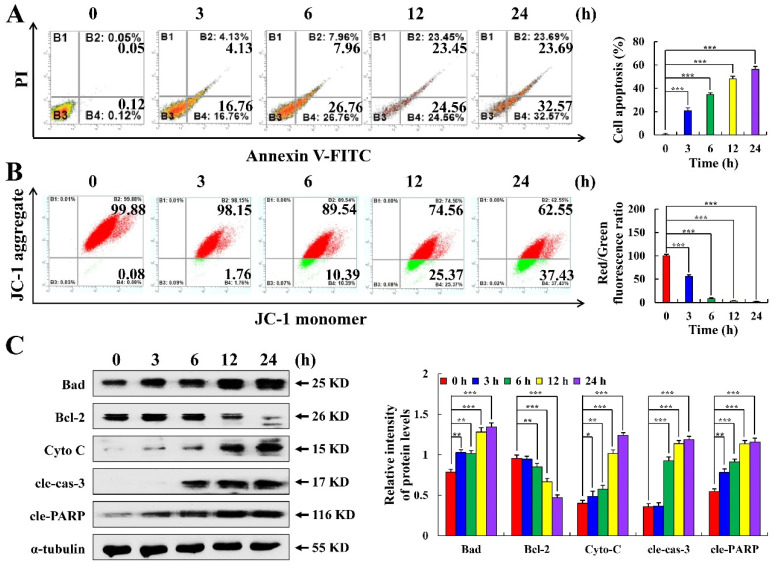
Figure 3.
Apoptotic effects of C3G on MKN-45 cells. (A) The rate of apoptotic cells was determined using flow cytometry. (B) MMP was detected using flow cytometry. (C) The protein expression level of MKN-45 cells treated with C3G was detected using Western blot. α-tubulin served as an internal reference (* p ≤ 0.05, ** p ≤ 0.01, *** p ≤ 0.001 vs. 0 h).

