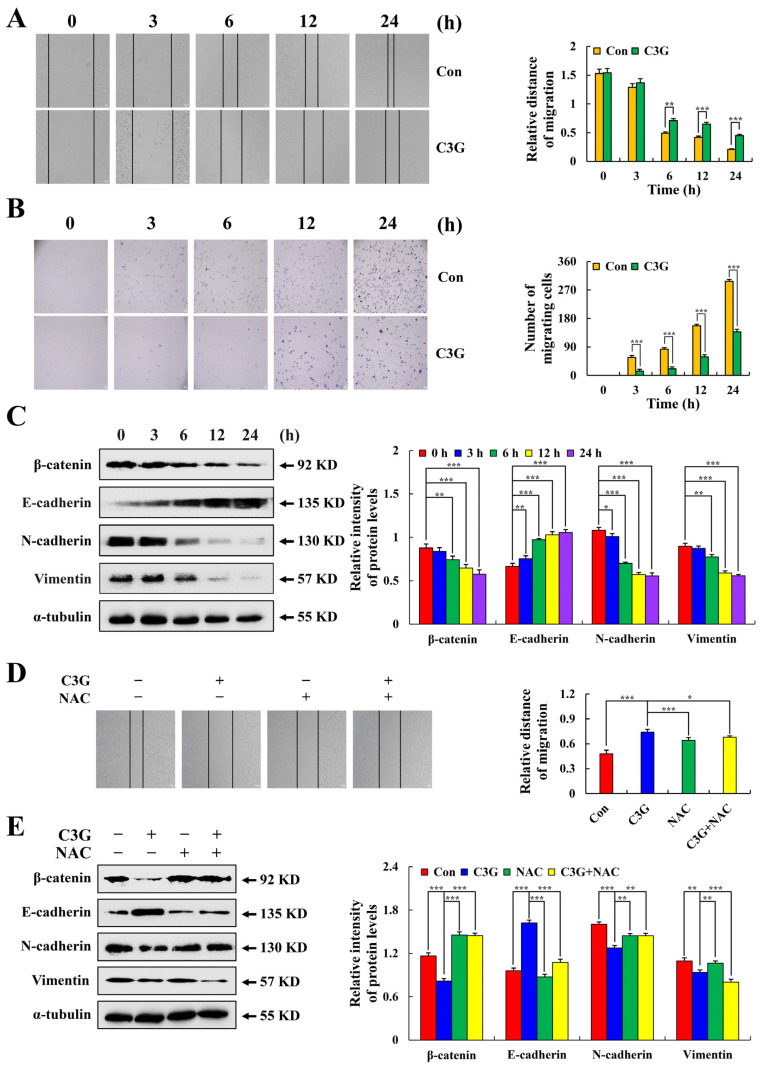
Figure 7.
Inhibitory effect of C3G on cell migration in MKN-45. (A) Cell migration was observed under an inverted microscope (original magnification 100×). (B) Migration number of MKN-45 cells (original magnification 100×). (C) Western blot analysis of migration related expression levels after C3G treatment. (D) MKN-45 cells were treated with C3G and NAC, and cell migration was observed under an inverted microscope. (E) Western blot analysis of the expression of migration related expression levels after C3G and NAC treatment. α-tubulin served as an internal reference (* p ≤ 0.05, ** p ≤ 0.01, *** p ≤ 0.001 vs. 0 h or the NAC + C3G group).

