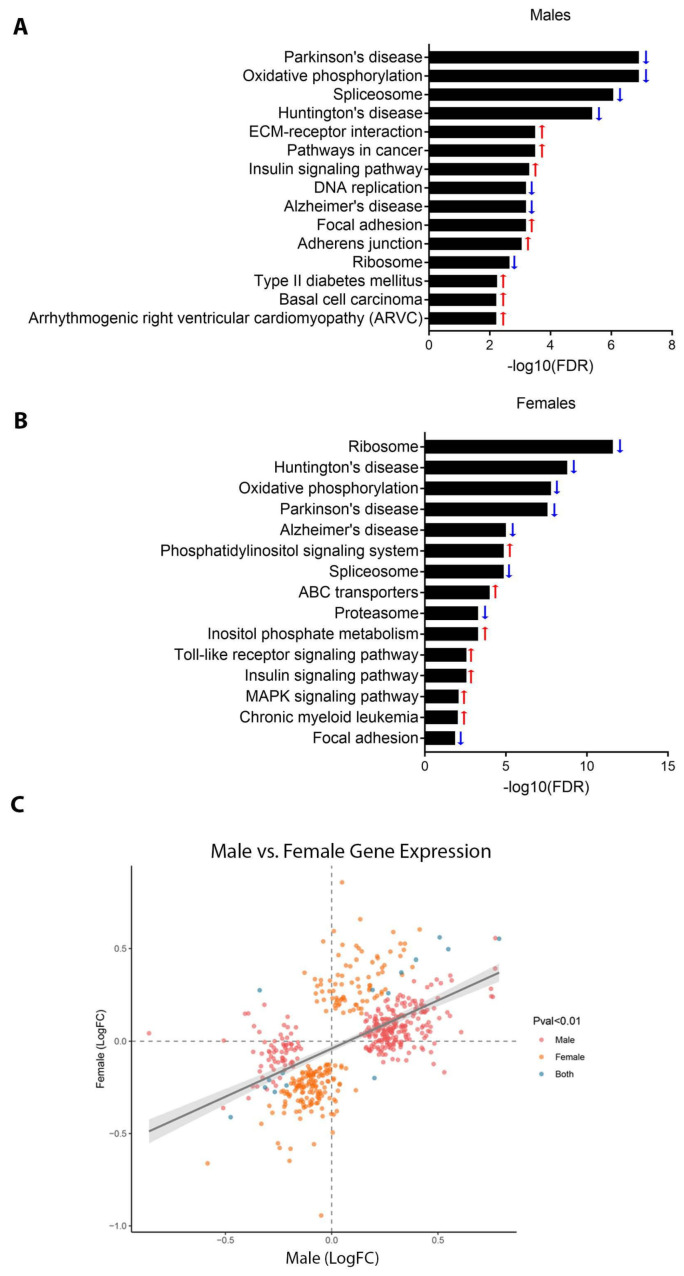
Figure 3.
RNA-seq data in weanling mouse hearts. (A,B) Results of KEGG pathway analysis of RNA-seq data, showing the top 15 most significant pathways for males (A) and females (B). Pathways are listed in order of decreasing significance from top to bottom (i.e., smallest to largest FDR). Blue and red arrows indicate reduced and increased expression of the pathway, respectively. (C) Scatter plot of all genes differentially expressed (DE) with Pb exposure with a p-value < 0.01, depicting correlations in log2 fold change with Pb exposure between males and females. Pink, orange and blue dots depict DE genes with a p-value <0.01 in males, females, or both, respectively. The p-value for correlation between males and females was determined using Pearson’s product-moment correlation.

