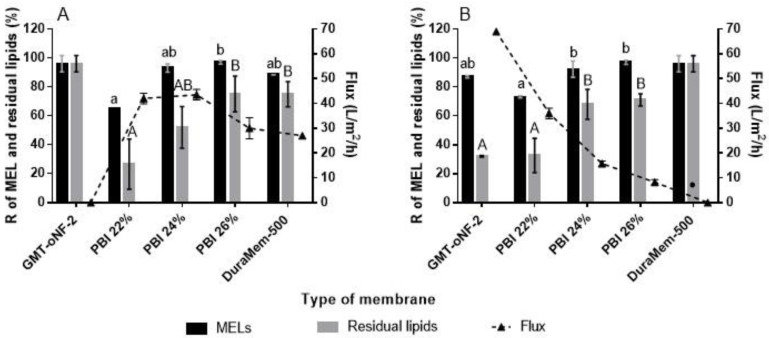
Figure 2.
The rejection coefficient for MELs and residual lipids, and the solvent flux for each OSN membrane: PBI 22, 24 and 26%; GMT-oNF-2 (Borsig) and DuraMem-500 (Evonik) using MeOH (A) and EtOAc (B). Dots refer to filtrations that did not occur, since no solution has permeated. Different lowercase and uppercase letters in each colunm represent significant variations in MELs and residual lipids rejections, respectively, for different membranes and the same solvent. Results for membranes highlighted in different letters have a p-value lower than 0.05.

