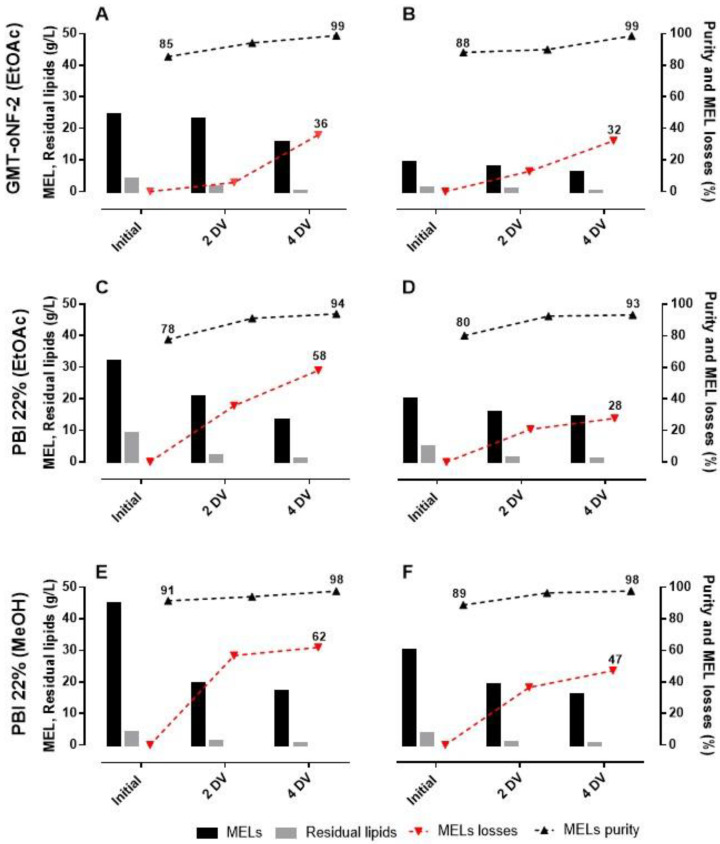
Figure 6.
Cascade system using OSN membranes: GMT-oNF-2 (C–F) and PBI 22% using EtOAc (A–D) and MeOH (E,F) as organic solvents. After the first filtration (A,C,F) the permeate was concentrated and passed again through the same membrane (B,D,E). Each graphic represents the concentration of MELs in the retentate (black bar), residual lipids (grey bar), MELs losses (red line with inverted triangles) and purity (black line with triangles). For all filtrations used, the volume was kept at 50 mL, and 15 bar of pressure was applied.

