Figure 1.
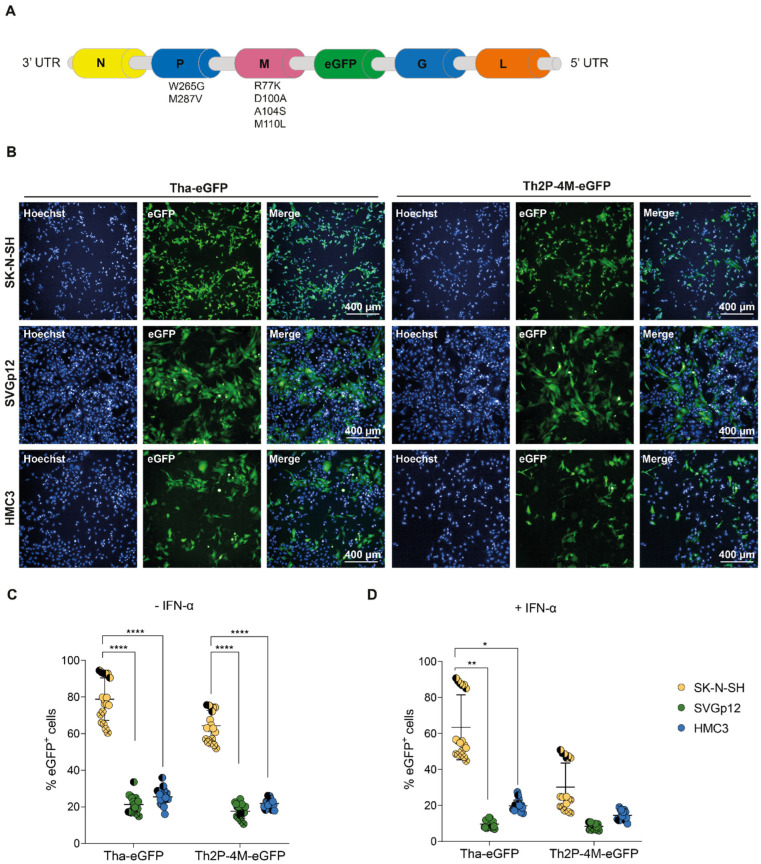
Tha-eGFP and Th2P-4M-eGFP preferentially replicate and spread in human SK-N-SH compared to astrocyte-like (SVGp12) and microglia-like (HMC3) cell lines in vitro. (A) Schematic overview of the genomic organization of Tha-eGFP and Th2P-4M-eGFP. Tha-eGFP and Th2P-4M-eGFP harbour the same genetic background except for two mutations introduced in viral P-protein (W265G, M287V) and four mutations introduced in the M-protein (R77K, D100A, A104S, and M110L) [26,31,32]. For imaging purposes, the eGFP sequence was introduced after the M-protein gene sequence as described previously [33]. (B) Representative immunofluorescence pictures of SK-N-SH, SVGp12, and HMC3 upon infection with Tha-eGFP and Th2P-4M-eGFP at 48 h post-infection. (C) Quantification of eGFP+ cells in human CNS monocultures upon Tha-eGFP or Th2P-4M-eGFP infection. (D) Quantification of eGFP+ cells in human CNS monocultures upon Tha-eGFP or Th2P-4M-eGFP infection and subsequent IFN-α treatment at 24 h post-infection. (B–D) Cells were infected with Tha-eGFP or Th2P-4M-eGFP (MOI 0.5) and imaged at 48 h post-infection. All experiments were performed three times (n = 3) independently. (C,D) Each dot represents imaging of one well of a 96-well-plate (approx. 8 × 10³ cells/well). Bars show mean ± SD. Different colours present different cell types, and different symbol shapes indicate the three technical replicates performed. Hoechst binds to regions of DNA in the minor groove visualizing cellular DNA. The percentages of eGFP+ cells were analysed using a mixed model with the replication factor as a random effect, followed by multiple comparisons corrected by Tukey’s method (**** adjusted p-value < 0.000016, ** adjusted p-value < 0.0016, * adjusted p-value < 0.0083). If no p-value is indicated, no significant difference was observed. eGFP = Enhanced Green Fluorescent Protein.

