Figure 5.
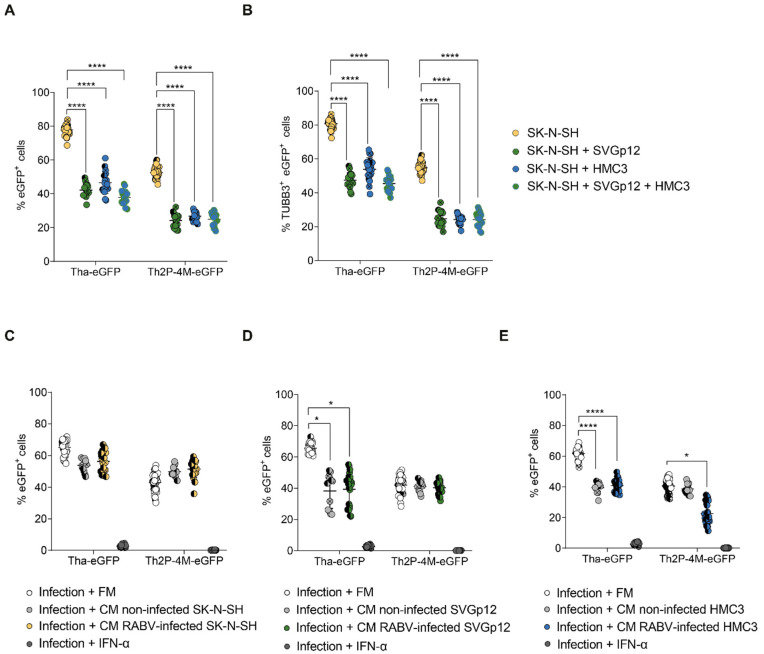
Astrocyte-like SVGp12 and microglia-like HMC3 constitutively protect SK-N-SH from Tha-eGFP infection in vitro. (A) Quantification of eGFP+ cells in mono- and co-cultures. (B) Quantification of TUBB3+ eGFP+ cells in mono- and co-cultures. (A,B) Mono- or co-cultures were infected with Tha-eGFP or Th2P-4M-eGFP (MOI 0.5) and imaged at 48 h post-infection using the Opera Phenix® High Content Screening System (Perkin Elmer). (C–E) Quantification of eGFP+ cells in SK-N-SH monocultures. After infection with Tha-eGFP or Th2P-4M-eGFP (MOI 0.5), SK-N-SH cells were incubated with the filtered fresh medium (FM) or filtered conditioned medium (CM) from non-infected or homotypic infected (MOI 5, 24 h post-infection) SK-N-SH (C), SVGp12 (D), or HMC3 (E). In detail, Tha-eGFP-infected cells were only treated with supernatants from cells previously infected with Tha-eGFP. Correspondingly, Th2P-4M-eGFP-infected cells were only treated with supernatants from cells previously infected with Th2P-4M-eGFP. Cells were imaged at 48 h post-infection. (A–E) All experiments were performed three times (n = 3) independently. Each dot represents imaging of one well of a 96-well-plate (approx. 8 × 10³ cells/well). Bars show mean ± SD. Different colours present different biological conditions, and different symbol shapes indicate the three technical replicates performed. The percentages of eGFP+ cells or eGFP+ TUBB3+ cells were analysed using a mixed model with the replication factor as a random effect, followed by multiple comparisons corrected by Tukey’s method (**** adjusted p-value < 0.000016, * adjusted p-value < 0.0083). (C–E) Comparisons between all conditions and infection + IFN-α treatment were significant but not indicated in the figure. For the remaining comparisons, if no p-value is indicated, no significant difference was observed.

