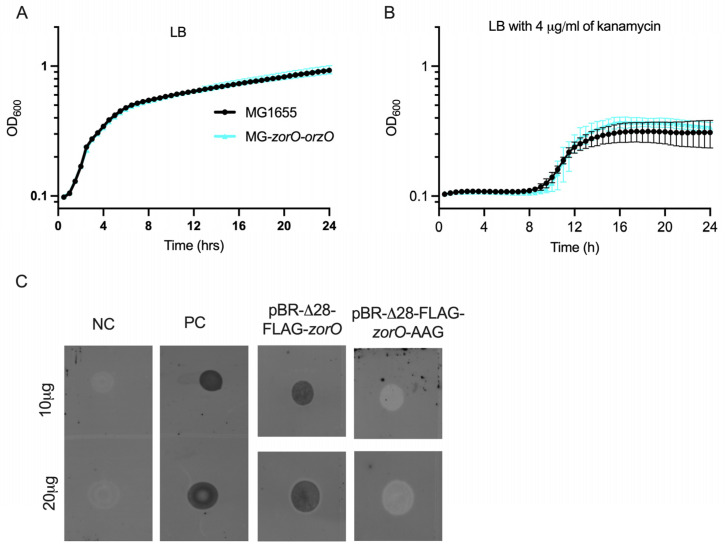
Figure 6.
Growth curve of E. coli with and without a chromosomal copy of zorO-orzO in LB (A) and in LB with 4 µg/mL kanamycin (B). n ≥ 3, shown are mean ± standard deviation. Dot-blot analyses for the detection of ZorO from E. coli UTK007 with pBR-Δ28-FLAG-zorO (C). NC—Negative control with empty vector. PC—Positive control with PBAD-FLAG-zorO. pBR-Δ28-FLAG-zorO-AAG—start codon of zorO coding sequence replaced with AAG.

