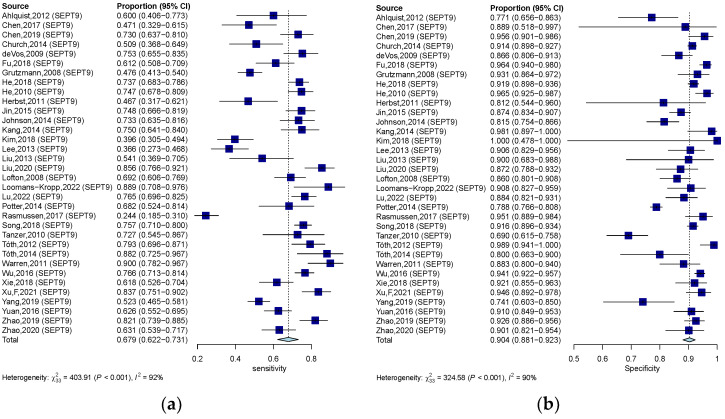
Figure 6.
Forest plots of SEN (a) and SPE (b) for diagnostic value of ctDNA assay for CRC in the SEPT-9 methylation detection subgroup. 95% CI, 95% confidence interval; CRC, colorectal cancer; ctDNA, circulating tumor DNA; SEN, sensitivity; SPE, specificity; diamond shapes representing average effect; dark blue squares representing individual study results.

