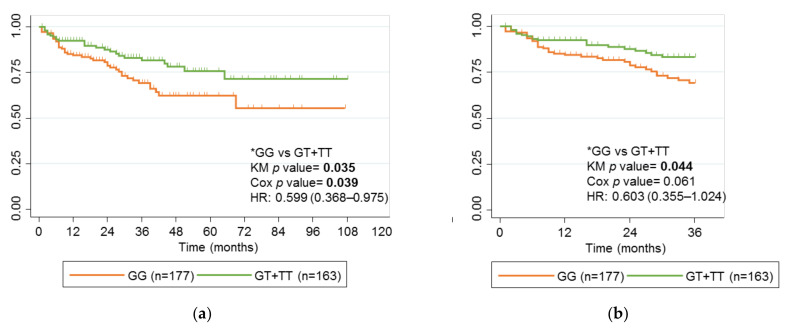
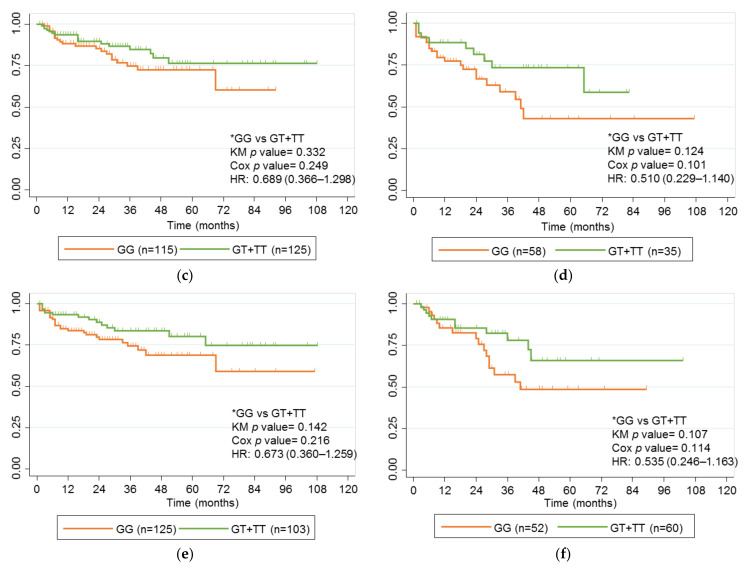
Figure 2.
Kaplan-Meier curves for rs2395185 and failure of anti-TNF therapy. (a) Children with IBD treated with anti-TNF drugs; (b) Children with IBD treated with anti-TNF drugs for 36 months; (c) Children with CD treated with anti-TNF drugs; (d) Children with UC treated with anti-TNF drugs; (e) Children with IBD treated with IFX; (f) Children with IBD treated with ADL. Genotype comparisons and p values for univariate analysis (KM p value) and multivariate analysis (Cox p value) are presented alongside Kaplan-Meier curves. Significant p values are marked in bold. * Reference genotypes.


