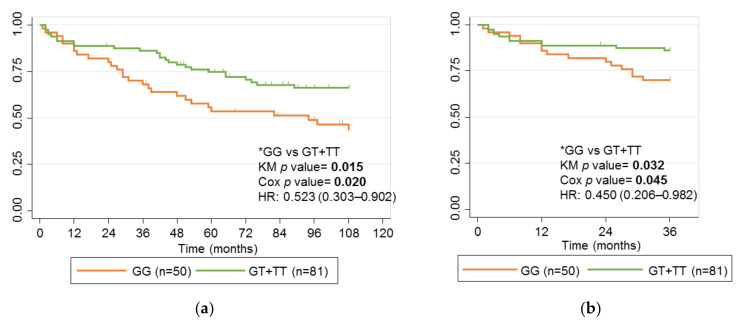
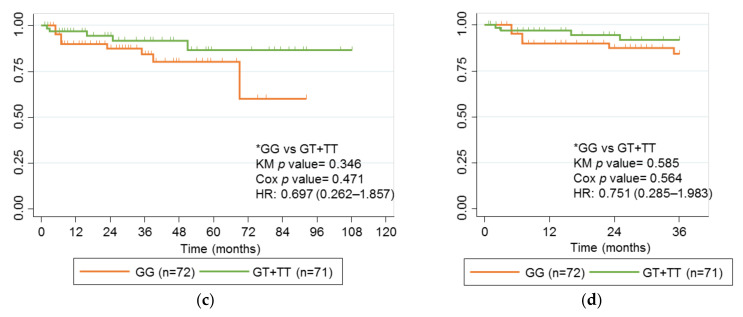
Figure 5.
Kaplan-Meier curves for rs2395185 and failure of IFX in children and adults with CD. (a) Adults with CD treated with IFX, follow-up 9 years; (b) Adults with CD treated with IFX, follow-up 3 years; (c) Children with CD treated with IFX, follow-up 9 years; (d) Children with CD treated with IFX, follow-up 3 years. Genotype comparisons and p values for the univariate analysis (KM p value) and multivariate analysis (Cox p value) analyses are presented alongside Kaplan-Meier curves. Significant p values are marked in bold. * Reference genotypes.


