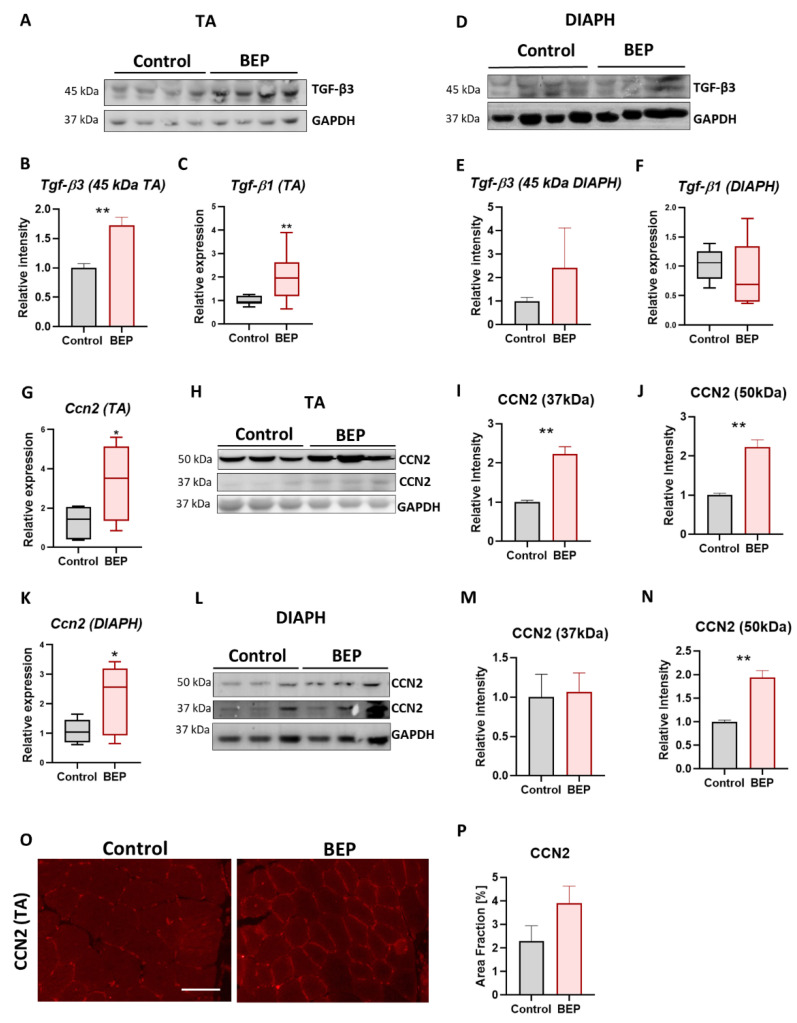
Figure 4.
Binge-like ethanol protocol induced profibrotic factors TGF-β and CCN2/CTGF. TGF-β expression in TA muscle. TGF-β3 protein levels with the respective densitometric analysis (A,B). Control N = 6, BEP N = 4. Relative mRNA levels of TGF-β1 (C). Control N = 3, BEP N = 4. TGF-β expression in DIAPH muscle. TGF-β3 protein levels with the respective densitometric analysis (D,E). Control N = 4, BEP N = 3. Relative mRNA levels of TGF-β1 (F). Control N = 3, BEP N = 4. Relative mRNA levels of Ccn2/Ctgf in TA (G) and DIAPH (K). (H,L) Immunoblot against CCN2/CTGF and GAPDH as a loading control, with the respective densitometric analysis of the 37 and 50 kDa immunoreactive bands. WB performed from whole muscle extracts from TA (H–J) and diaphragm (L–N). Control N = 4, BEP N = 4. (O) Representative images of TA immunostaining using anti-CCN2/CTGF antibody. Scale bar 100 µm. (P) Quantification of CCN2/CTFG as a percentage of occupied area fraction. Control N = 3, BEP N = 4. p-values: * p ≤ 0.05; ** p ≤ 0.01.

