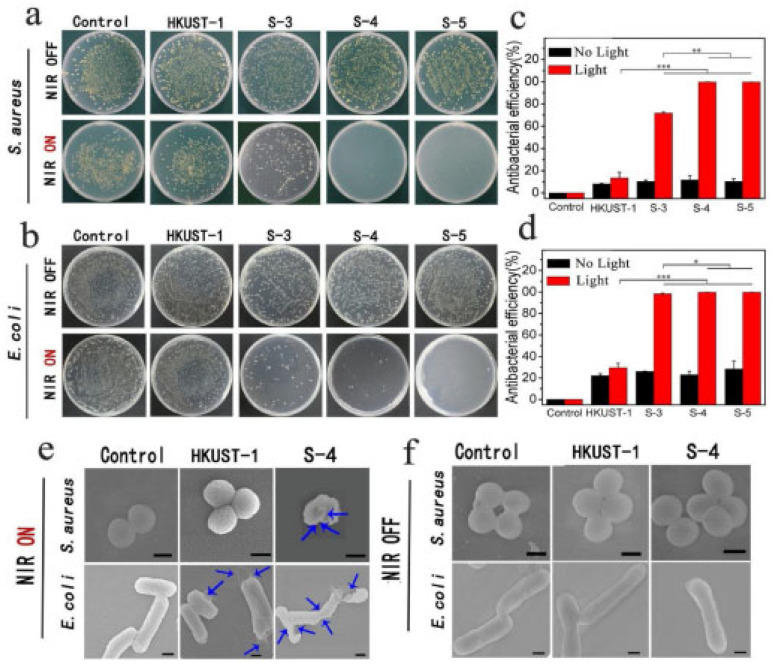
Figure 12.
(a,b) In vitro antimicrobial studies. (c,d) %Antibacterial efficiency of MOFs against E. coli and S. aureus, respectively, error bars show ± standard deviation of * p < 0.05, ** p < 0.01, and *** p < 0.001. (e,f) Morphology of E. coli and S. aureus with NIR on and OFF, arrows in (e) pointing to the disrupted morphology of E. coli and S. aureus upon irradiation with NIR. Reproduced with permission from [93].

