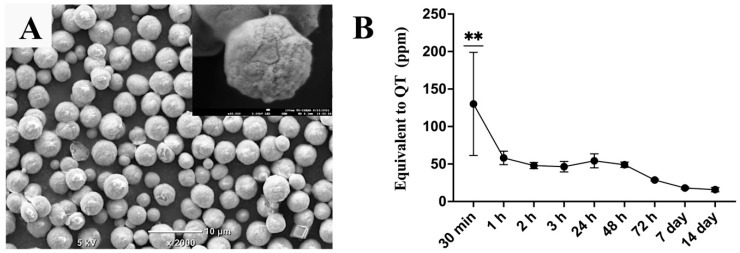
Figure 1.
(A) Scanning electron microscopy image of the QT-incorporated calcium carbonate microcapsules. (B) Total flavonoid-content assay demonstrating a release profile of QT from the microcapsules incubated in phosphate buffer saline at 37 °C for 14 days; magnification bars represent 10 μm. The symbol ** denotes that the value is significantly higher than at other investigation times, with p < 0.01 (n = 5, mean ± SD).

