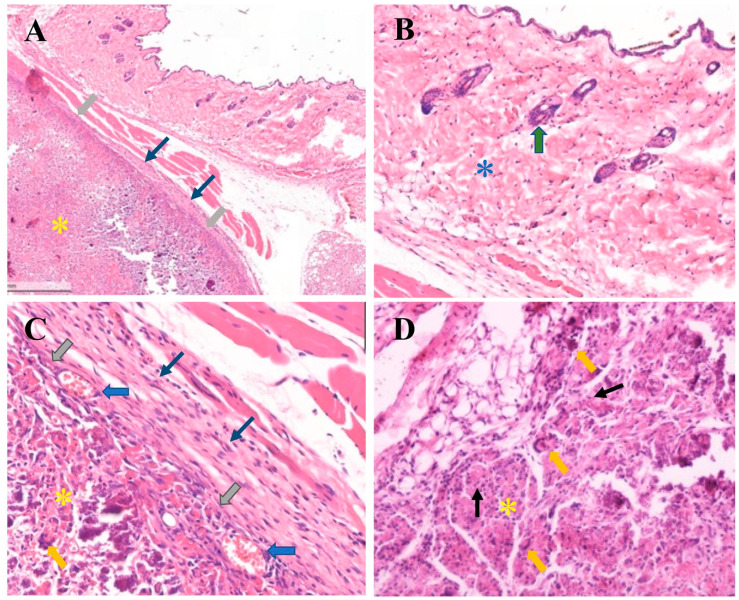
Figure 11.
Histological images of the subcutaneous implants of a hydrogel group; the thermosensitive 2% (w/v) calcium carbonate microcapsule–2% nanohydroxyapatite–10%β-glycerophosphate–4:1 (w/w) chitosan/collagen hydrogels were subcutaneously implanted in C57BL/6NJcl mice for 4 weeks (A–D). (A) Spatial implant/tissue interface exhibiting that the sample is separated from the host tissue by thin layers of fibrous connective tissue (thin blue arrows), and thick grey arrows indicate inter-surface contact between the subcutaneous tissue and a residual implant or hydrogel (yellow asterisks). (B) A high magnification of mouse skin comprises dense fibrous connective tissue (blue asterisk), the hair follicle (thick green arrow), and keratinized epithelium. (C) A high magnification of a sample/tissue interface exhibiting multiple layers of connective tissue (thin blue arrows), direct contact of the sample, and the connective tissue layers (thick grey arrows) with infiltration of small blood vessels at the interface (thick blue arrows). (D) Exhibiting the residual implant or hydrogel (yellow asterisk), and low numbers of lymphocytes infiltration (chronic inflammatory cells) (thin black arrows) and multinucleated giant cells (thick yellow arrows) (hematoxylin and eosin, H&E stain), (A) magnification 10×; (B–D) 40×).

