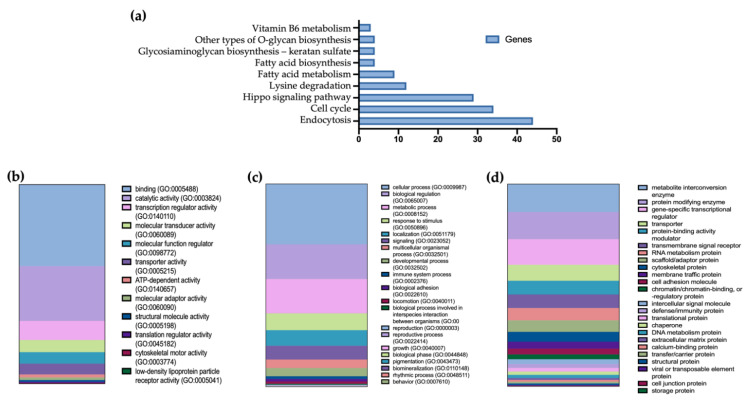
Figure 3.
miR-24-3p and miR-543 enrichment pathway analysis. (a) Bar plot showing Kyoto Encyclopedia of Genes and Genomes (KEGG) pathway for all predicted target genes expressed as the number of genes per pathway. (b) Gene Onthology Molecular Processes, (c) Gene Onthology Biological Processes, and (d) Protein Classes affected by miRNAs target genes, and expressed as the number of target genes involved in each process.

