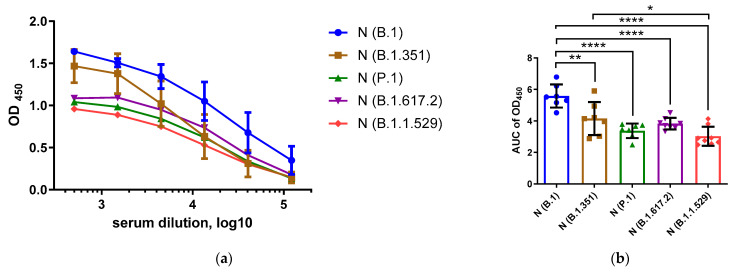
Figure 1.
Assessment of homologous anti-N antibody levels in serum samples of mice immunized with B.1 (blue), B.1.351(brown), P.1 (green), B.1.617.2 (magenta) and B.1.1.529 (red). Hereafter, the color designations of the N proteins of different SARS-CoV-2 VOCs are the same. The OD450 values are shown in (a), and the area under the OD450 curve (AUC) values are shown in (b). These data were compared using ANOVA with the Tukey post hoc test. * p < 0.05, ** p < 0.01, **** p < 0.0001.

