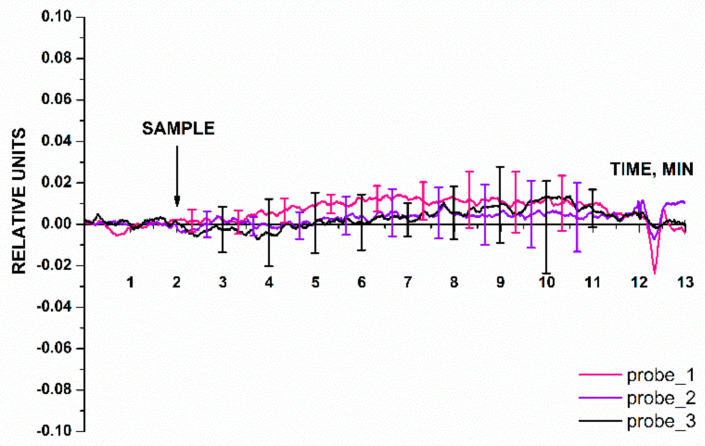
Figure 8.
Typical sensorgram curves recorded in the blank experiments, in which the oDNA-free buffer was added into the measuring cell instead of target oDNA solution. Experimental conditions: nanowires with immobilized oDNA probes (probe_1, probe_2, and probe_3); 1 mM PPMB; Vg = 50 V, Vds = 0,2 V; solution volume in the measuring cell was 450 µL. Number of technical replicates, n = 5. The arrow indicates the time point when the buffer under study (SAMPLE) was added.

