Figure 3.
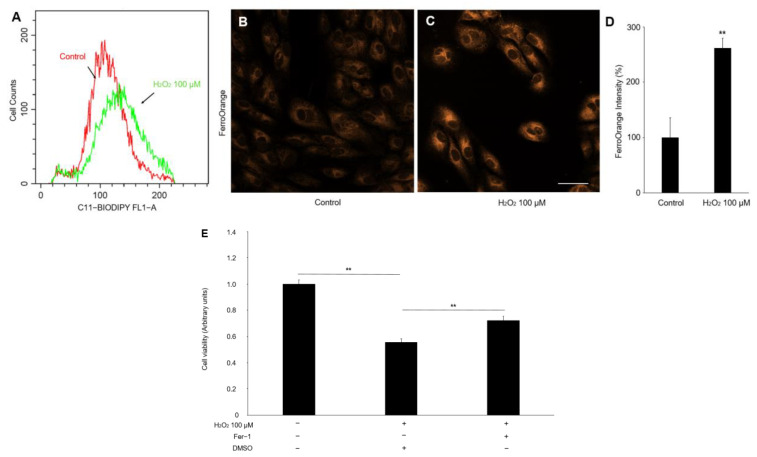
The lipid peroxidation and Fe2+ level in the ARPE-19 cells treated with hydrogen peroxide. (A) The fluorescence histogram plot of the lipid-peroxidation production in ARPE-19 cells by BODIPYTM 581/591. (B–D) Representative fluorescent images and quantitative analysis of intracellular iron level in ARPE-19 cells using FerroOrange (orange). Scale bar, 50 μm. (E) Cell viability assay. n = 5 in each group, ** p < 0.01.

