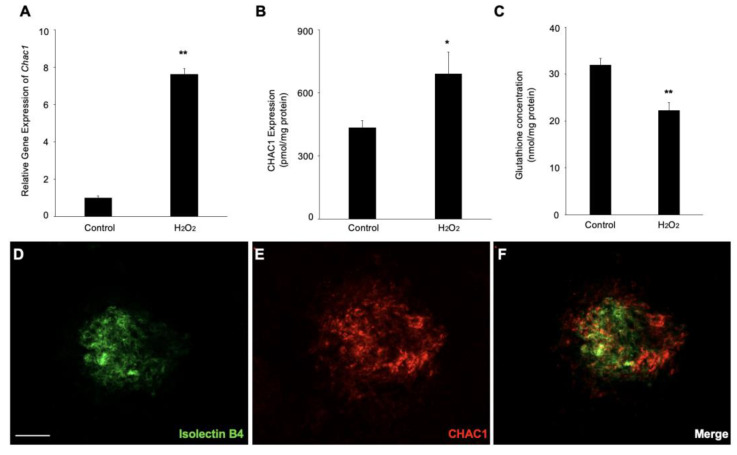
Figure 5.
Gene and protein expression levels of Chac1 in ARPE-19 cells with hydrogen-peroxide stimulation. (A) Real-time PCR analysis for Chac1. (B) CHAC1 protein levels in ARPE-19 cells with hydrogen peroxide stimulation. (C) GSH assay. (D–F) Double labeling of CHAC1 (red) and isolectin B4 (green) in CNV mice at day 7. Scale bar = 100 μm. n = 6 in each group. * p < 0.05, ** p < 0.01.

