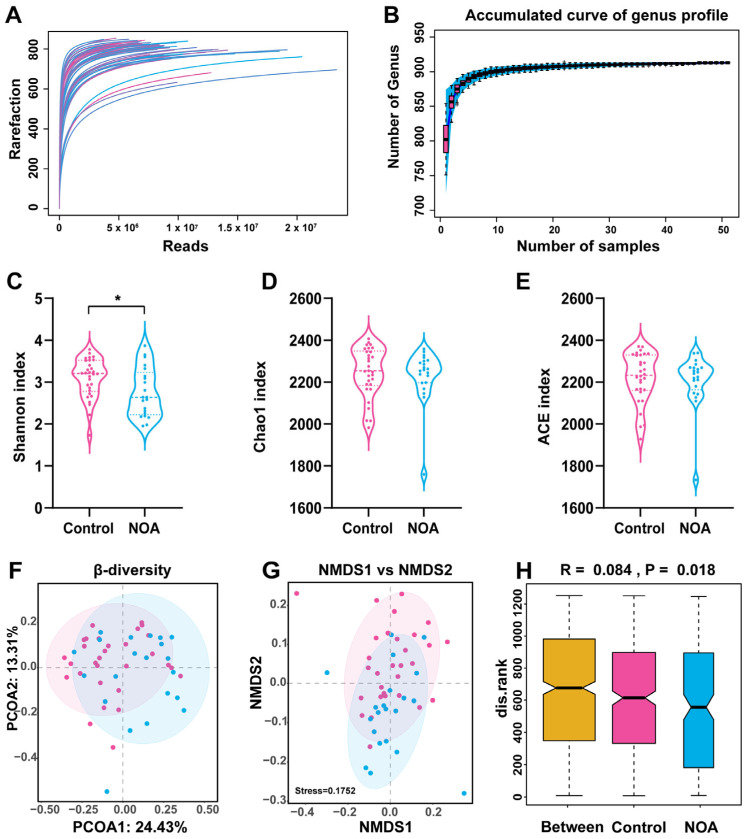
Figure 2.
Overview of the gut microbiome in the two experimental groups. Gut microbial diversity was analyzed on the basis of shotgun metagenomic sequencing. Rarefaction curves of reads (A) and accumulation curve of genus profile (B) are presented. Shannon index (α-diversity) (C), Chao1 index (D), and ACE index (E) were used to describe α diversity of gut microbiota in the two groups. Bacterial command compositional similarity was evaluated by β diversity. Plots of principal coordinate analysis (PCoA) with Bray–Curtis distance (F) and non-metric multidimensional scaling (NMDS) (β-diversity) (G) at species levels are shown. Analysis of similarities (Anosim) (H) was used to detect differences between the two groups. * indicates significance (p < 0.05) when control group is compared with NOA group. Pink represents control group and blue represents NOA group.

