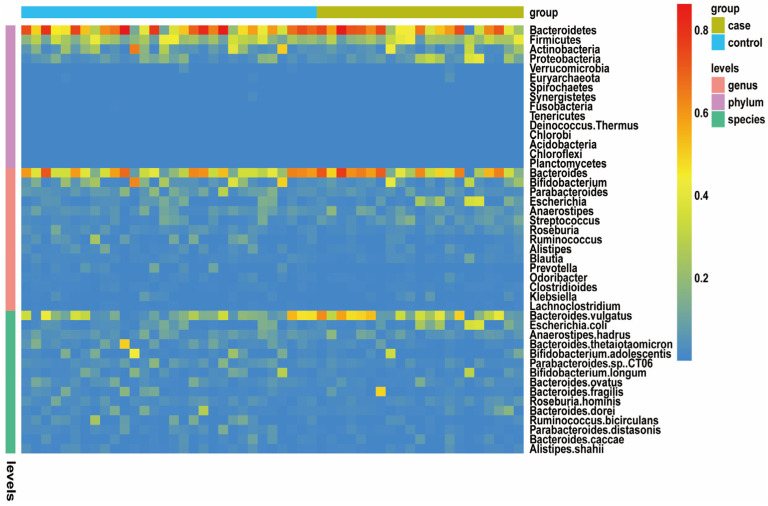
Figure 3.
Taxonomic features of the gut microbiota of the healthy control (n = 30) and patients with NOA (n = 21). An overview of the 15 most abundant phyla, 15 most abundant genera, and 15 most abundant species in the stool samples. The taxa levels are presented by relative abundance. Gut microbiota abundance is represented by color gradient. Red indicates high abundance, and blue indicates low abundance.

