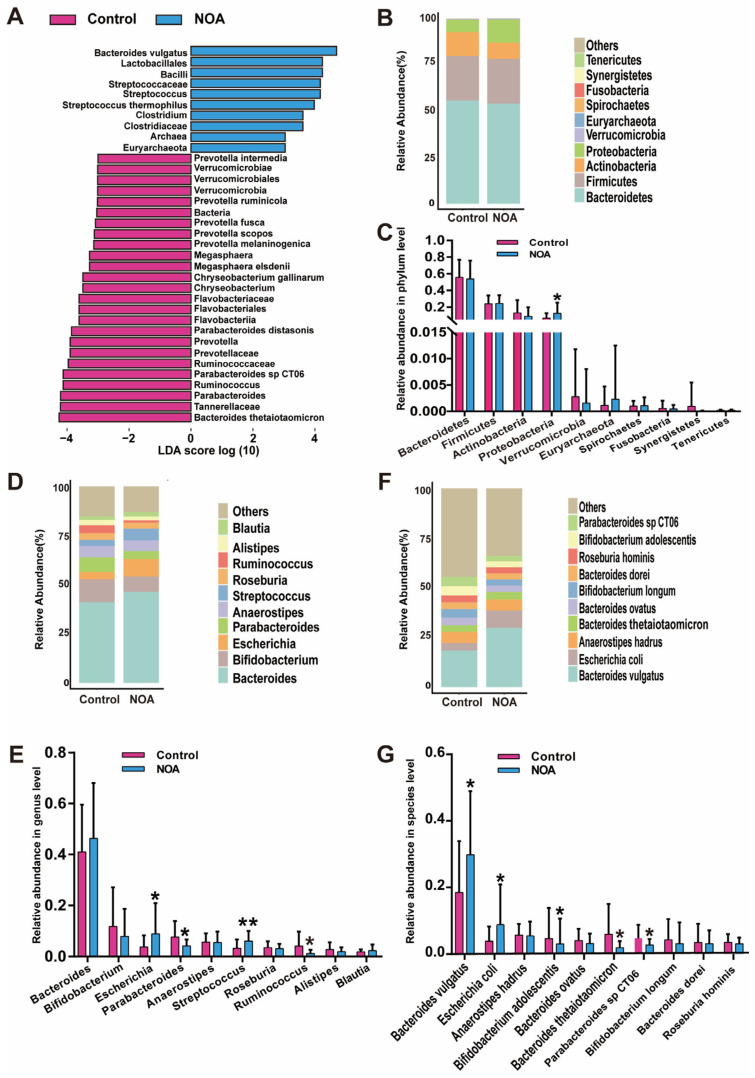
Figure 4.
Changes in the taxonomic composition of microbial communities. (A) Linear discrimination analysis (LDA) effect size (LEfSe) identified the statistical differences in the levels of biomarkers between the control and NOA groups. The LDA scores (log 10) > 3 are listed. The top ten bacteria, with maximum abundance of fecal bacteria at the phylum (B), genus (D), and species (F) levels. Significant changes in abundance at the phylum (C), genus (E), and species (G) levels; (pink) taxa enriched in the control group, (blue) taxa enriched in the NOA group. Values represent means ± SEM. * indicates significance (p < 0.05), ** indicates significance (p < 0.01) when control group is compared with NOA group.

