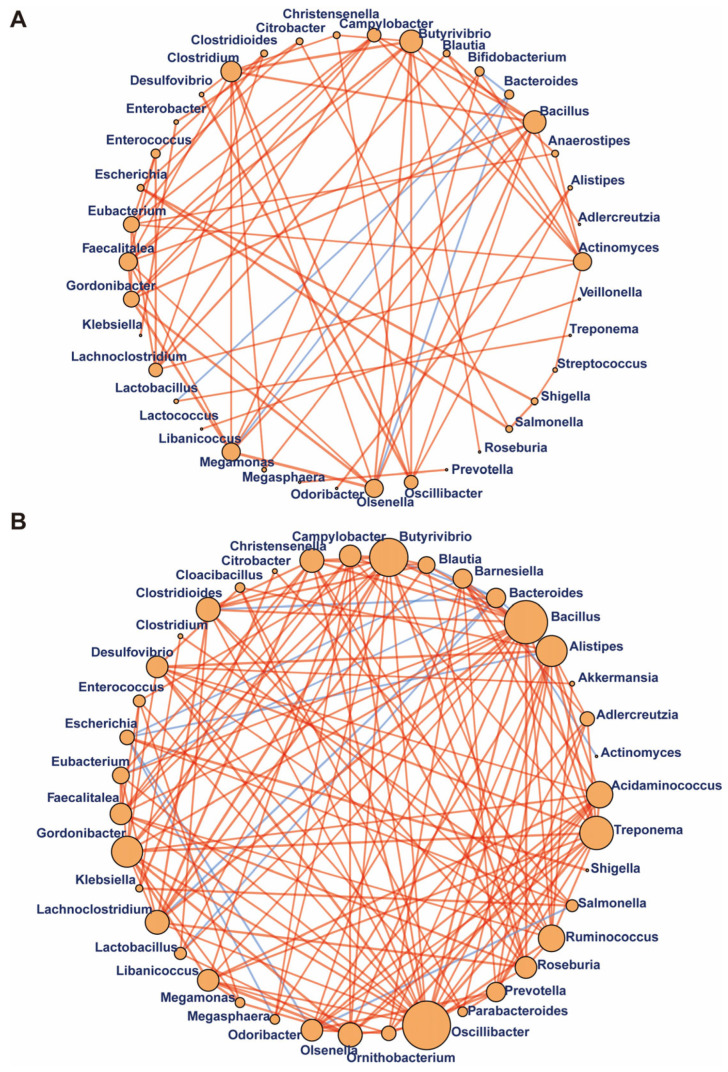
Figure 5.
Gut bacterium–bacterium correlation networks in control and NOA groups. Significant positive (orange) and negative (blue) pairwise correlations between different bacteria at the genus level in the control group (A) and NOA group (B), respectively. Network nodes indicated different core bacterial genera, and edges represented the significant correlation among the nodes. The size of the nodes reflects the degree of connection.

