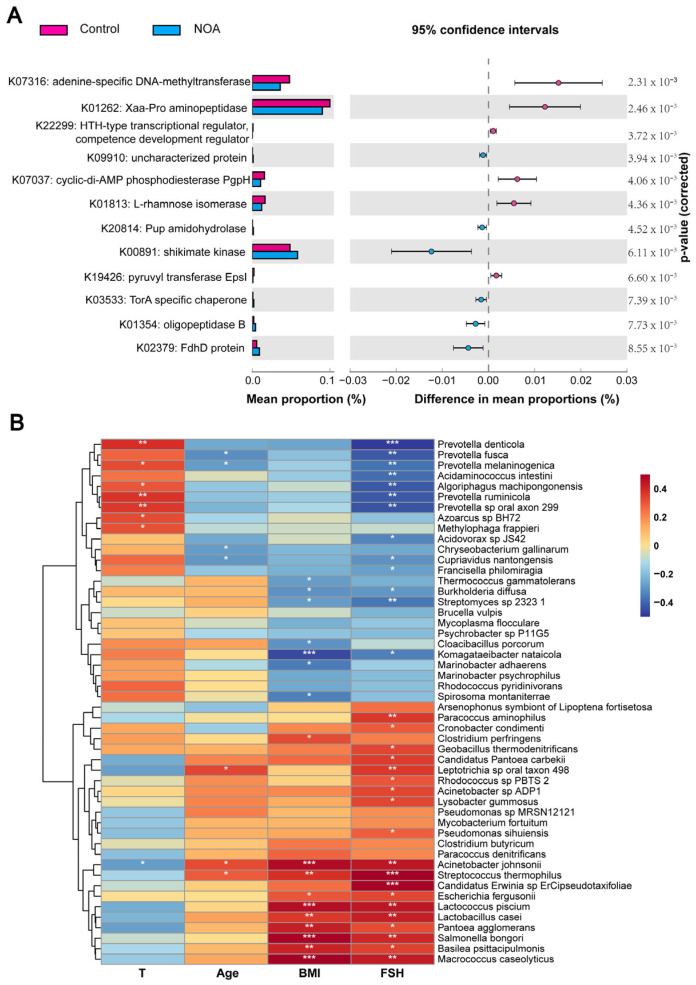
Figure 6.
Functional characterization of microbiome and correlation analyses between gut microbiota and clinical parameters. (A) Pairwise comparison between control (pink) and NOA (blue) samples demonstrating differences in KEGG orthology (KO) (p < 0.01) shown as mean proportion (%) and difference in mean proportions (%) with 95% confidence intervals; p values are shown after correcting for negative controls. (B) Heat map of the correlation between differential microbiome at the species level and clinical parameters of NOA. Spearman’s rank correlation coefficient is indicated using a color gradient. Red represents positive correlation and blue represents negative correlation. * p < 0.05, ** p < 0.01, *** p < 0.001.

