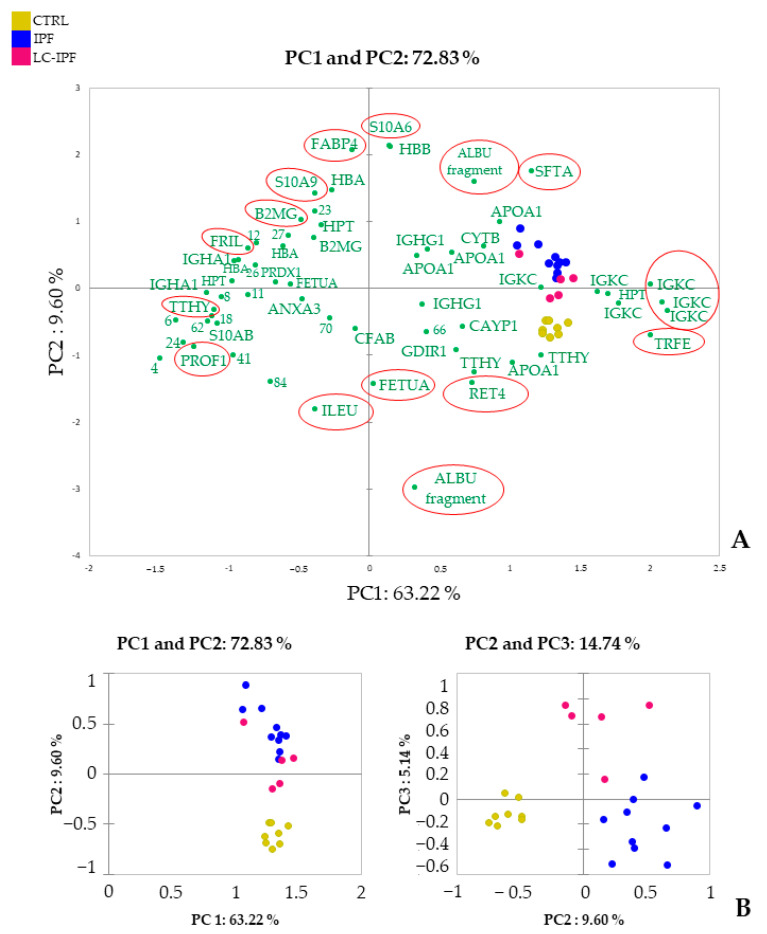
Figure 3.
Supervised PCA analysis performed using the DASs detected by proteomic analysis of BALF samples. (A). The image reports the contributions of each significant variant in the first two principal components (PC1 and PC2). Red circles mark the most influential spots on the samples distributions. (B). Plots highlight the spatial distribution of the analyzed samples along the PC1 and PC2, and PC1 and PC3.

