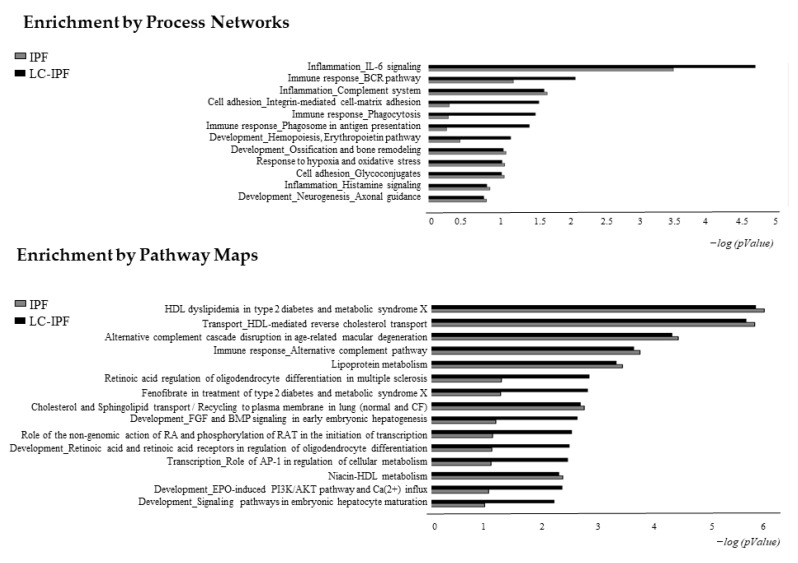
Figure 5.
Histograms reporting the Process Networks and Pathway Maps comparisons of up-regulated proteins in IPF and in LC-IPF. Black histograms represent the −log(p-value) related to up-regulated proteins in LC-IPF BALF; grey histograms show the −log (p-value) related to up-regulated proteins in IPF BALF.

