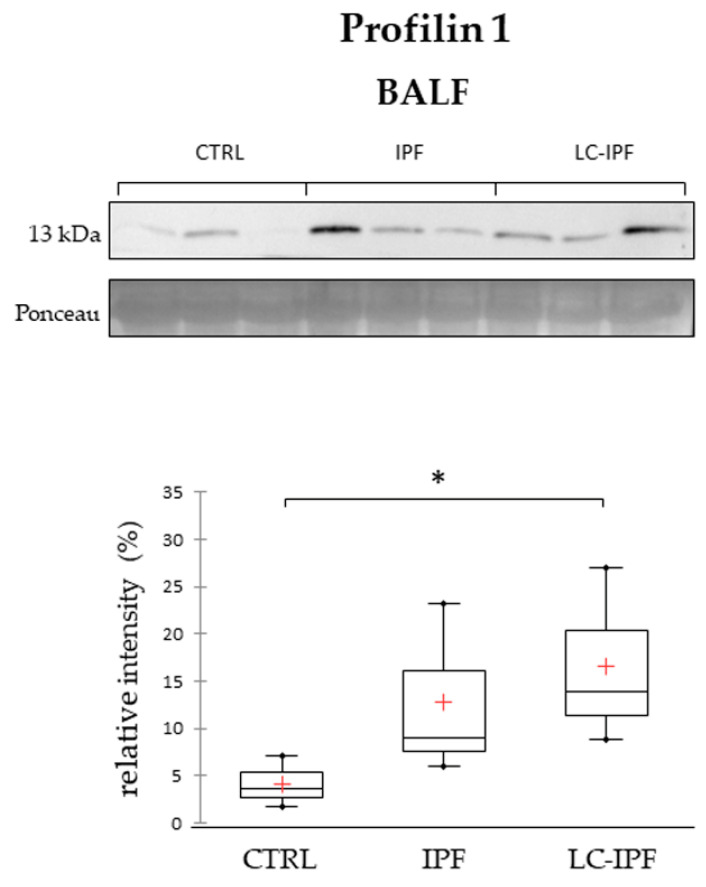
Figure 6.
Western blot analysis of profilin 1 in BALF samples. Statistical analysis was performed by Kruskal–Wallis test and Dunn correction and reported in the Box plots (∗ p-value < 0.05). Ponceau red is reported to assure the equal loaded amount of sample and for intensity normalization. BALF samples used for WB were three for CTRL, three IPF, and three for LC-IPF. Samples used were three for CTRL, three IPF, and three for LC-IPF.

