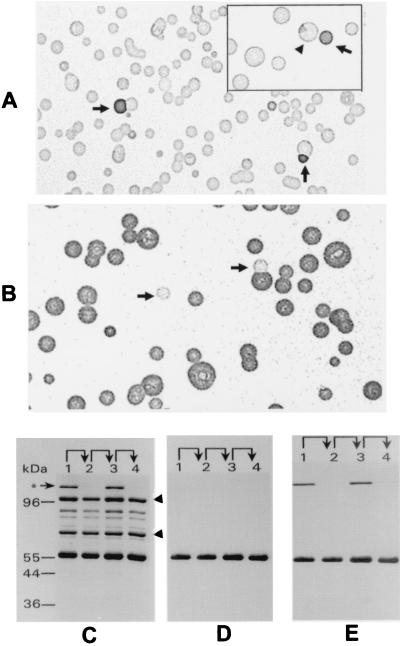
FIG. 2.
Phase variation of the P56 phenotype, detected by colony immunoblotting and protein profiles. Panel A shows the presence of P56+ variants (indicated by arrows) in a clonal P56− population. A sectored colony is shown (arrowhead) in the insert. Panel B shows revertant P56− variants (indicated by arrows) derived from a propagated P56+ colony that was selected from the population represented in panel A. TX-114 phase membrane proteins of a successive lineage (P56− [lane 1]→P56+ [lane 2]→P56− [lane 3]→P56+ [lane 4]) were analyzed by SDS-PAGE and Western immunoblotting. Panel C shows a gel stained with Coomassie brilliant blue. The arrowheads indicate the positions of the P100 protein (100 kDa) and the G5 protein antigen (70 kDa). Panel D represents a Western blot immunostained with Ab to P56. The blot shown in panel D was subsequently immunostained with MAb 26.7D to P120 (panel E). The asterisk indicates the position of P120. Protein molecular size markers are shown at the left of panel C.

