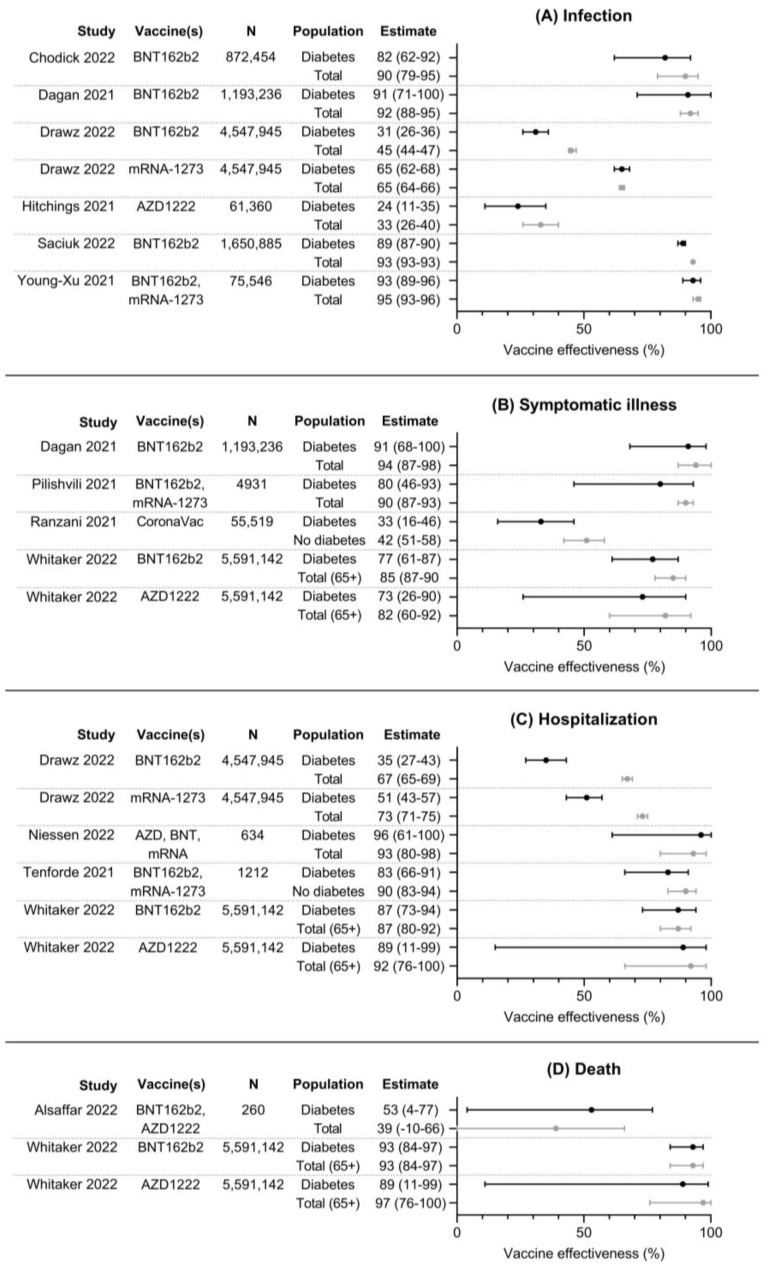
Figure 2.
Forest plots with point estimates and 95% confidence intervals of effectiveness of COVID-19 vaccines against (A) infection, (B) symptomatic illness, (C) hospitalization, and (D) death. N denotes total number of participants per study, as numbers per group were usually not available [20,22,23,25,26,27,29,31,32,33,34,35].

