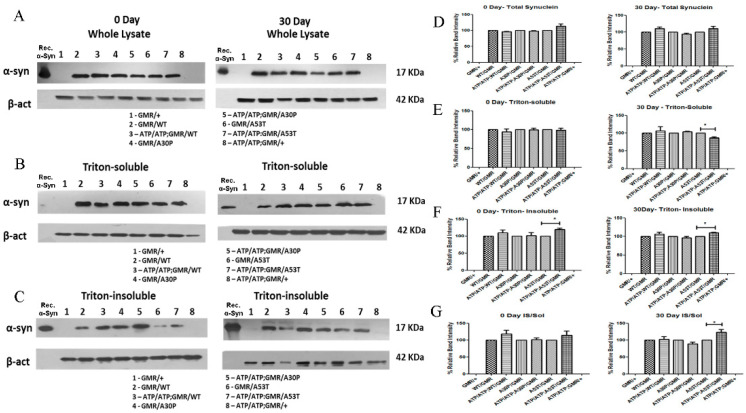
Figure 3.
Effect of ATP13A2 silencing on α-syn protein expression and accumulation. Immunoblotting was performed using the whole-tissue lysis extraction method with fly heads (A), and densitometric analysis of the immunoblots revealed no accumulation of WT, A30P, or A53T α-syn during ATP13A2 silencing under GMR-Gal4 drive compared to control flies expressing α-syn alone (D). Triton-soluble α-syn levels in ATP13A2 RNAi flies expressing WT, A30P, and A53T syn were analyzed by Western blotting of day 0 and day 30 fly heads (B). The corresponding densitometric graph where ATP13A2 RNAi flies expressing WT, A30P, and A53T syn were normalized to 100% of the respective controls (GMR with α-syn) is shown (E). Triton-insoluble α-syn levels in ATP13A2 RNAi flies expressing WT, A30P, and A53T syn were analyzed by Western blotting of heads from day 0 and day 30 flies (C). The corresponding densitometric graph (F). Ratio of syn in the triton-insoluble to soluble fraction of Day 0 and Day 30 samples (G). The graph represents the mean ± S. E. M for three independent experiments. Differences in means were compared by one-way ANOVA followed by the Newman–Keuls Multiple Comparison post hoc test. * p < 0.05.

