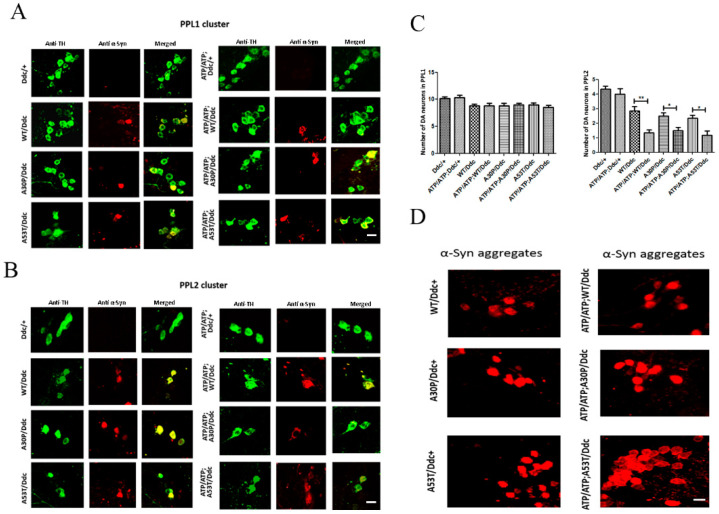
Figure 4.
Neurodegeneration in ATP13A2 silencing flies expressing α-syn. Representative image of projected Z-series of PPL1 (A) and PPL2 (B) clusters in 30-day-old fly brains under the control of Ddc-Gal4 driver. The image shows co-staining of anti-TH (green) and anti-syn antibody (red) antibodies, revealing only a few neurons expressing α-syn in the PPL1 cluster compared to abundant expression in the PPL2 cluster in different genotypes under the Ddc-Gal4 driver. (C) Relative number of DA neurons within the PPL1 and PPL2 cluster of ATP13A2-silenced 30-day-old flies with Ddc-Gal4 driver-expressing WT, A30P, and A53T α-syn (n = 12) compared to age-matched control flies without ATP13A2 RNAi (n = 12). Differences in means were compared using one-way ANOVA followed by the Newman–Keuls Multiple Comparison post hoc test. ** p < 0.001; * p < 0.05. (D) Representative immunofluorescent staining of 30-day-old fly brain expressing WT, A30P, and A53T α-syn with or without ATP13A2 RNAi under Ddc-Gal4 driver stained for α-syn aggregates-specific antibody, showing a gross increase in aggregates in α-syn mutants, especially A53T, during ATP13A2 silencing. Scale bar 10 µm.

