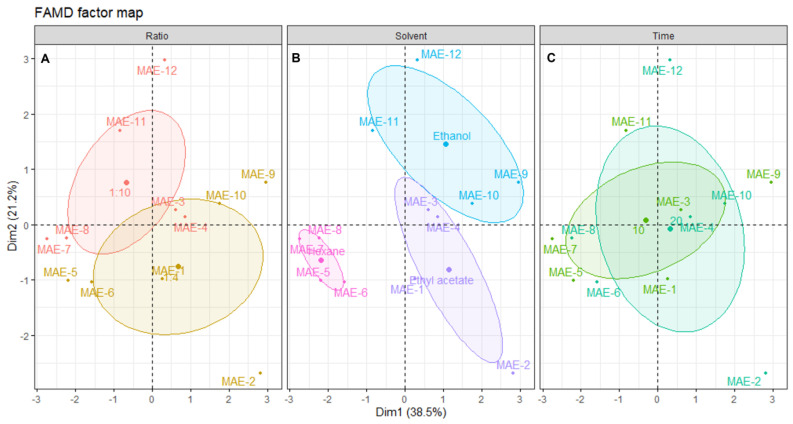
Figure 5.
Plot of MAE individuals showing the distribution of samples across the dimensional space. Each panel shows the distribution centered in: (A) solid/liquid ratio, (B) solvent and (C) time of extraction. The shaded ellipsoids depict the 95% confidence ellipsis for outcomes as a function of dimensions 1 and 2.

