Table A1.
Sandblasted Surface, 3 Bars.
| M(S = {Sandblasting, 3 bar}, A = {ContourGT}, C = {×20}, N = {100}) | |
|---|---|
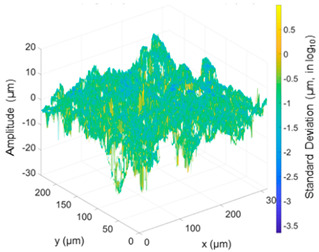
| Fluctuations, on 3D topography | Mean amplitude map, μi,j |
| % NaN = 15.4%, Sq = 3.7 µm | % NaN = 6.7% |
|

|
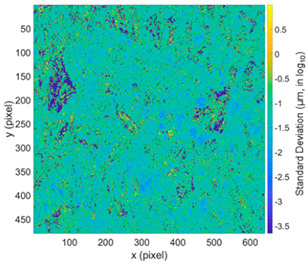
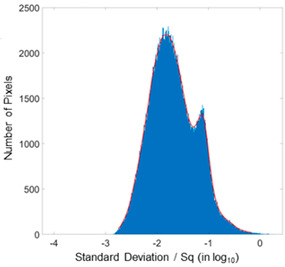
| Standard deviation map, σi,j | Histogram of fluctuations (in log10) |
| % NaN = 7.8% | |
|
|
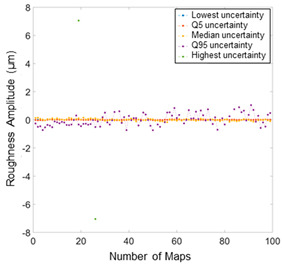
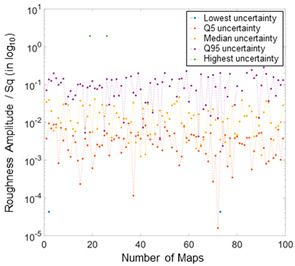
| for five percentiles of fluctuations |
for five percentiles of fluctuations (in log10) |
|
|
