Table A4.
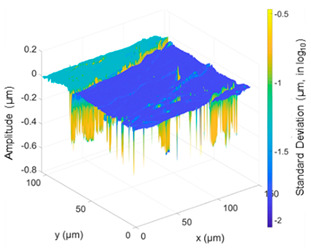
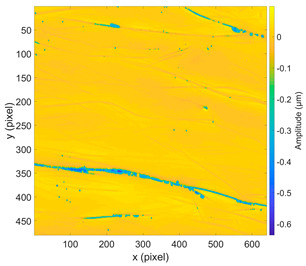
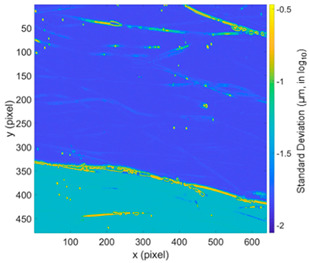
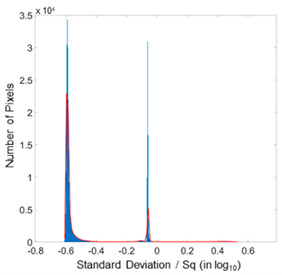
Abraded Ophthalmic Lens (Essilor), Location n°2.
| M(S = {Abraded lens}, A = {NewView7300}, {2²}, C = {×50}, N = {100}) | |
|---|---|
| Fluctuations, on 3D topography | Mean amplitude map, μi,j |
| % NaN = 0.10%, Sq = 56.0 nm | % NaN = 0% |
|
|
| Standard deviation map, σi,j | Histogram of fluctuations (in log10) |
| % NaN = 0.00031% | |
|
|
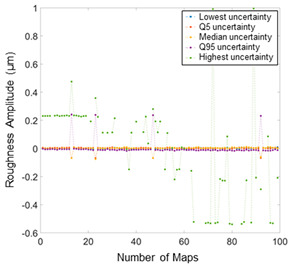
| for five percentiles of fluctuations |
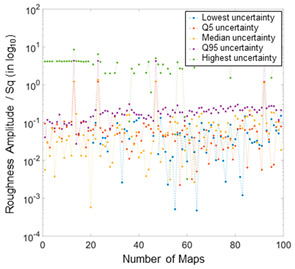
for five percentiles of fluctuations (in log10) |
|
|
