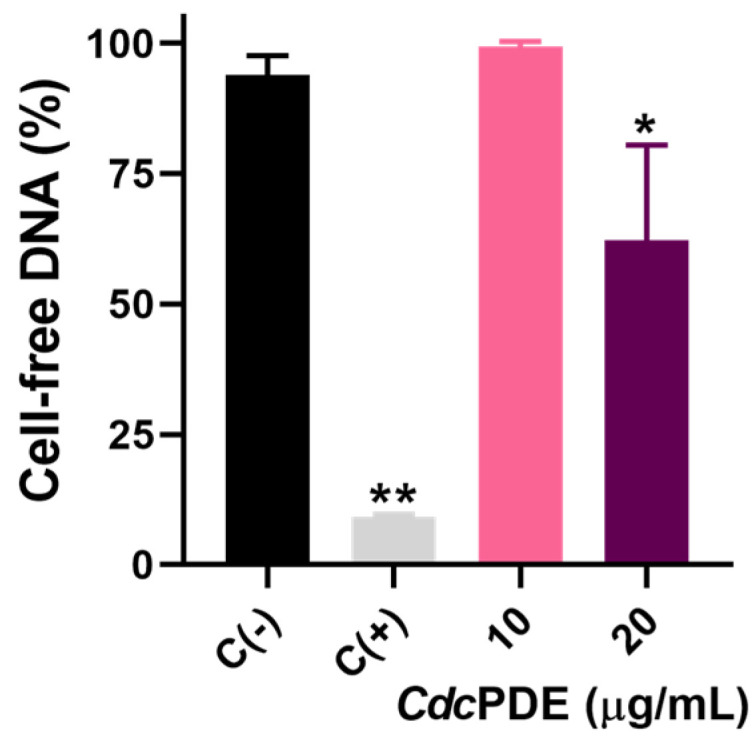
Figure 2.

Cell-free DNA degradation assay. Isolated DNA were treated with PBS, DNase1 (500 μg/mL), or CdcPDE (10 or 20 μg/mL) for 30 min at 37 °C. Wells were stained with 0.2 μM SYTOX Green for 10 min. Fluorescence emission intensities were determined using 488-nm excitation and 525-nm emission. The results are presented as relative fluorescence units (RFU) and bars express percentages relative to the PBS group. C (−): wells treated with PBS. C (+): wells treated with DNAse (500 μg/mL). * p < 0.01 and ** p < 0.0001 when compared with C (−). Data (n = 3) are presented as mean ± SD, which were analyzed by one-way ANOVA and Tukey’s post-hoc test using GraphPad Prism 9 software.
