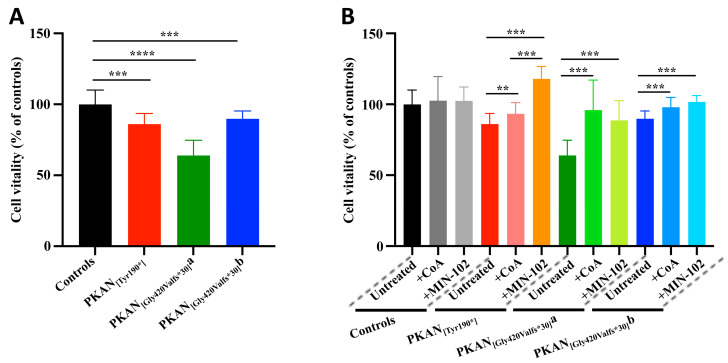
Figure 3.
Plots showing the vitality of the astrocytes (50–60 days of differentiation). Cells were grown in astrocyte medium in the presence or absence of MIN-102 (100 nM) or CoA (25 μM) from day 0 of differentiation, and vitality was measured by MTT assay. (A) Plot showing the untreated astrocytes only, and (B) plot showing the complete experiment. All data are expressed relative to the untreated control astrocytes. One-way ANOVA, ** p < 0.01, *** p < 0.001, **** p < 0.0001. Mean ± SD, at least sixteen replicates for all the samples.

