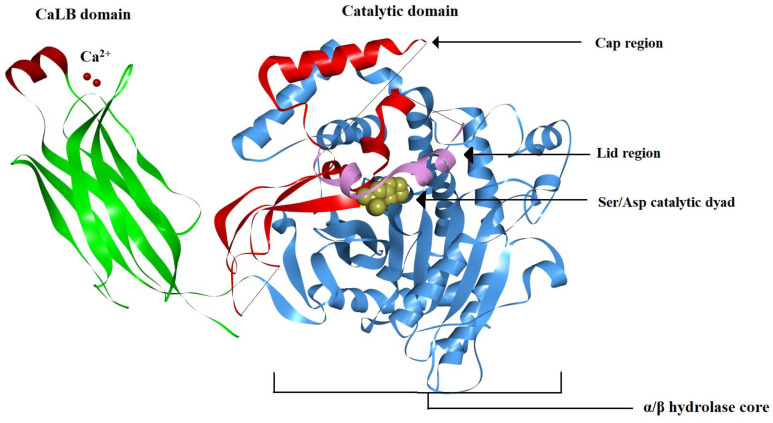
Figure 11.
Ribbon diagram of a typical cPLA2 (PDB: 1CJY). The Ca2+-dependent lipid-binding (CaLB) domain is shown in green on the left side of the figure, with the two bound Ca2+ ions (required for protein translocation to the membrane) shown as red spheres. The catalytic domain is shown on the right side, the α/β hydrolase core is shown in blue and the catalytic dyad Ser/Asp is shown in yellow. The enzyme cap is shown in red, and the lid region covering the active site funnel is colored pink. The lid region prevents the lipid substrates to come in contact with the active site [31]. (Image generated using BIOVIA Discovery studio.)

