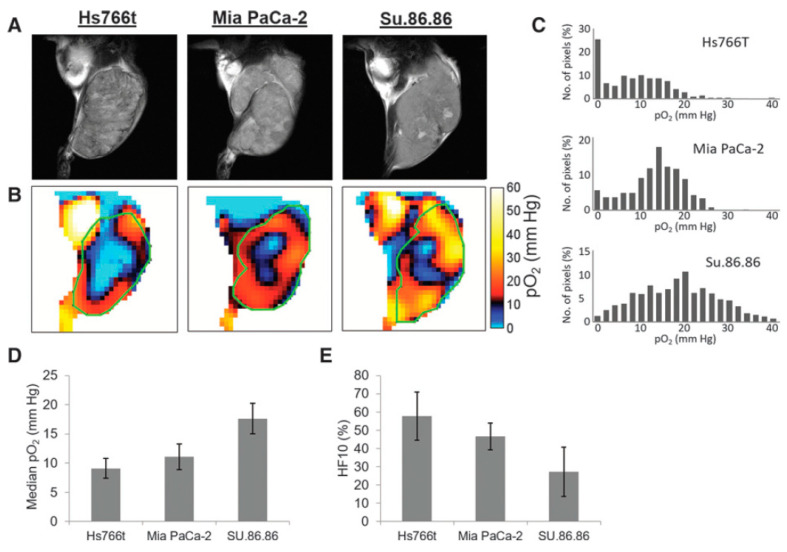
Figure 6.
Co-registration of oxygen maps and anatomical images. (A), T2-weighted anatomical images of Hs766t, MiaPaCa2, and Su.86.86 tumors obtained by MRI. (B), Oxygen maps of the three tumors obtained by EPR imaging. ROI of the tumors selected from the anatomical images were overlayed for computing functional parameters. (C–E), Histograms of pO2 distribution in the three tumors (C), median pO2 (D), and hypoxic fraction with less than <10 mm Hg pO2 (E) of the pancreatic tumors.

