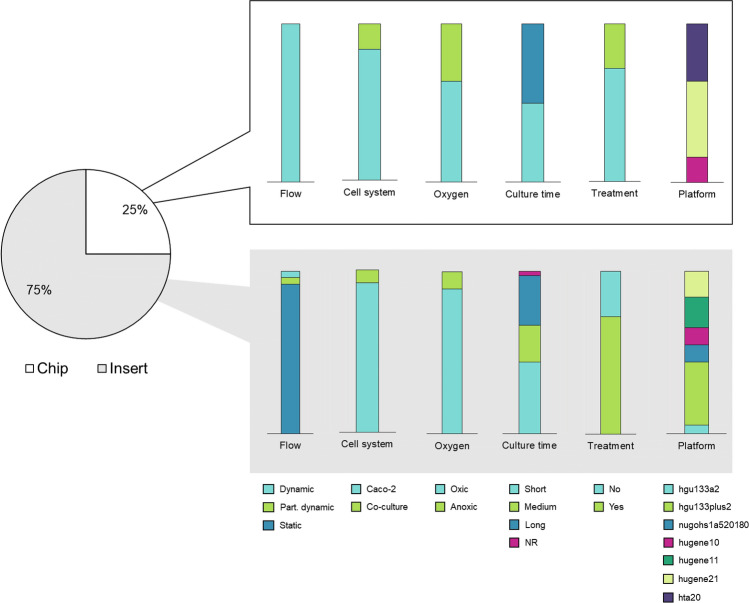
Fig. 2.
Overview of samples per model. Pie chart and bar chart represent no. of samples as percentage of total samples (s = 100) analyzed on an Affymetrix platform. For simplicity, the variable “Microbiome” is only divided into “Yes” and “No”. NR not reported, hta20 Human Transcriptome Array 2.0, hugene21 Human Gene 2.1 ST Array, hugene11 Human Gene 1.1 ST Array, hugene10 Human Gene 1.0 ST Array, nugohs1a520180 NuGO array (human) NuGO_Hs1a520180, hgu133plus2 Human Genome U133 Plus 2.0 Array, hgu133a2 Human Genome U133A 2.0 Array

