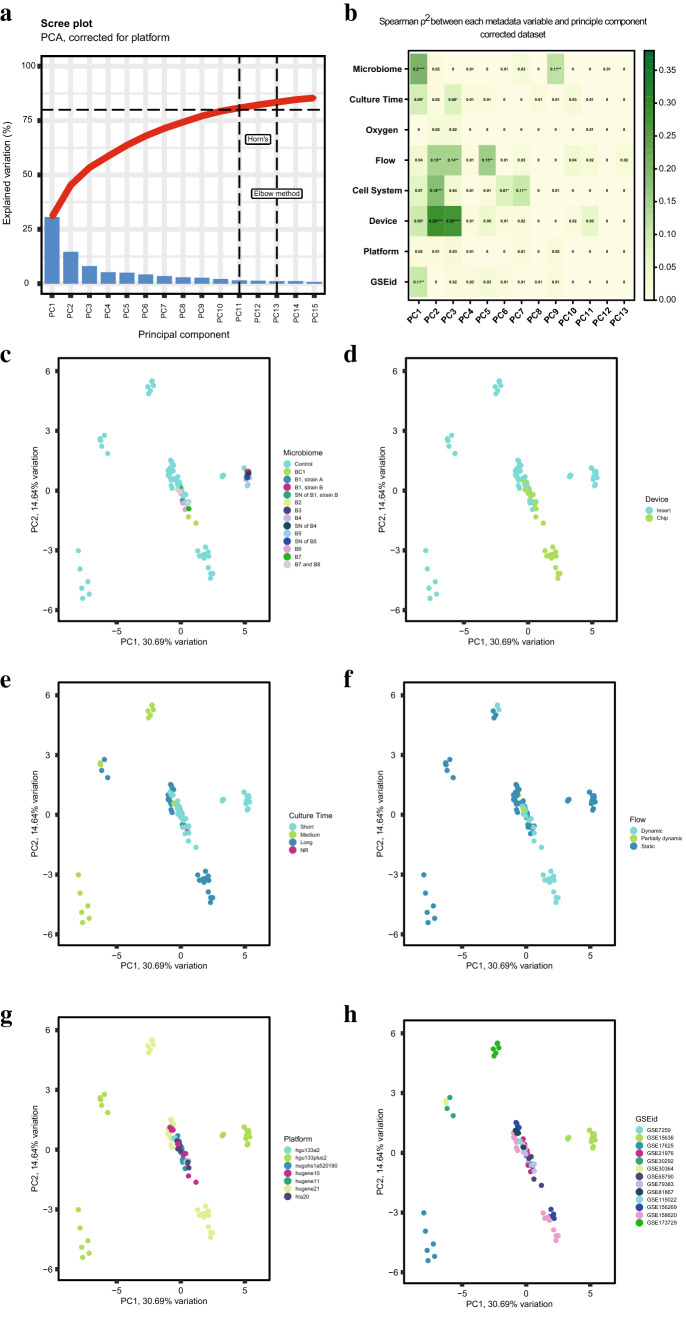
Fig. 3.
Multilevel principal component analysis at model level. After correction for platform, a principal component analysis was performed on a total of 11,203 shared genes, distinguishing eight experimental variables. a Scree Plot visualizing the variation explained by 18 PCs. b Spearman correlation ρ2 per model variable for the first 13 PCs. PCA plots of the first two components are provided and labeled by c microbiome (further defined in Table 1), d culture time, e device, f model, g array platform and h GSEid. PCA plots of oxygen and cell system can be found in Online Resource 3. *p < 0.05; **p < 0.01; ***p < 0.001; ****p < 0.0001. B# = Bacterium #; BC# = Bacterial Community #; SN supernatant, NR not reported; hta20 Human Transcriptome Array 2.0, hugene21 Human Gene 2.1 ST Array, hugene11 Human Gene 1.1 ST Array, hugene10 Human Gene 1.0 ST Array, nugohs1a520180 NuGO array (human) NuGO_Hs1a520180, hgu133plus2 Human Genome U133 Plus 2.0 Array, hgu133a2 Human Genome U133A 2.0 Array

