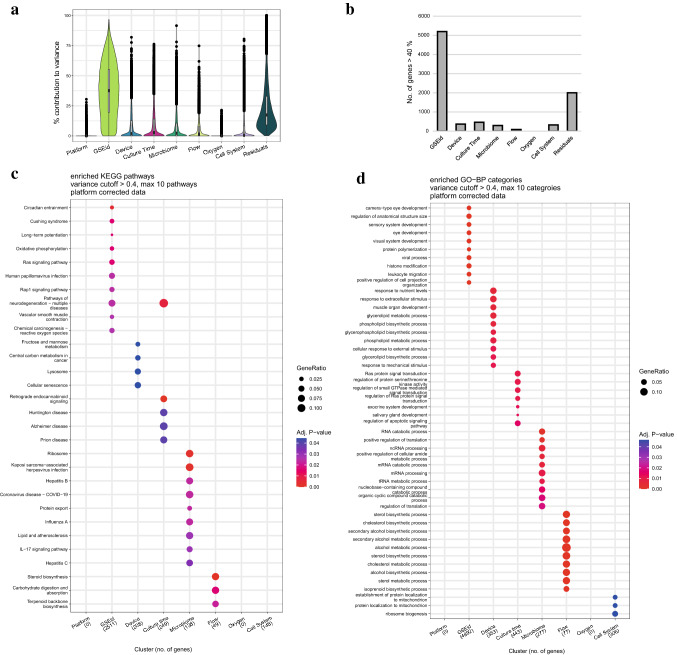
Fig. 5.
Variance partition analysis of all genes shared between samples (s = 100, g = 11,203). a Violin plot shown the percentage contribution of each variable to the expression of all genes. Based on the uncorrected data (Online Resource 4), a cut-off of 40% was chosen. b Number of genes of which contribution of respective variable was more than 40%. The overrepresentation of pathways within these genes in c KEGG Pathways and d GO-BP are displayed per variable

