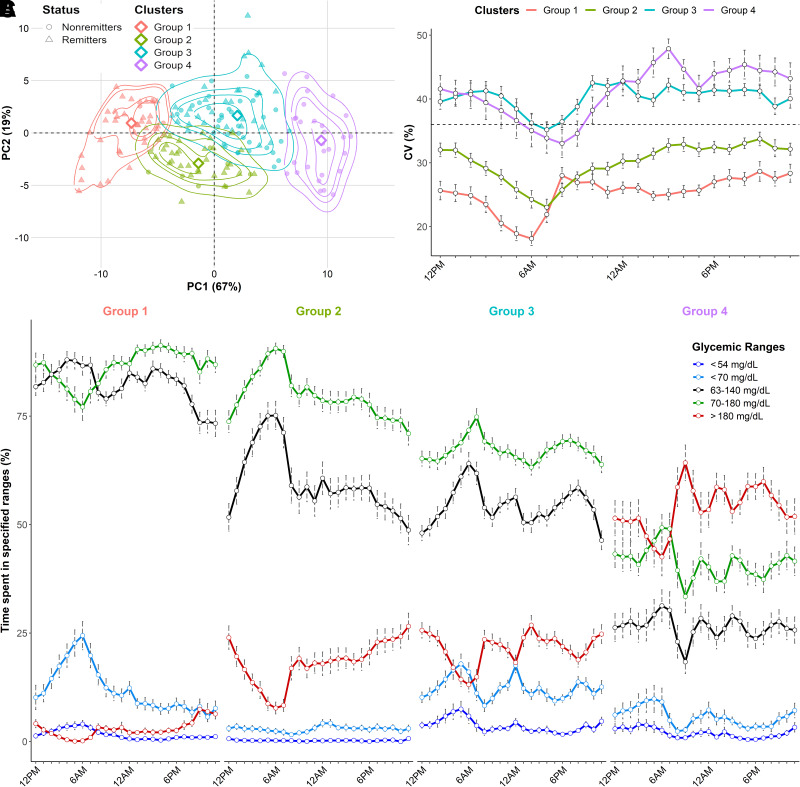
Figure 3.
Illustration and characterization of glycemic clusters identified by unsupervised hierarchical clustering on CGM metrics and clinical data during the first year of diabetes. Routine clinical parameters and CGM metrics were obtained at 3, 6, 9, and 12 months after diagnosis. A: Repartition of the clustering groups across the principal component analysis data. The empirical distributions of the patients across each group are represented by isoprobability contours of kernel densities at 25th, 50th, 75th, and 95th percentiles. The medoid of each group is represented by a diamond. B: Circadian evolution of CV (%) according to the clustering groups. The dashed line represents the threshold of 36%. C: Daily patterns of time spent in defined glycemic ranges <54 mg/dL (dark blue), <70 mg/dL (light blue), between 63 and 140 mg/dL (black), between 70 and 180 mg/dL (green), and >180 mg/dL (red). Error bars represent the SEs. Gray horizontal bars represent nighttime, and orange horizontal bars represent daytime.

