Figure 2.
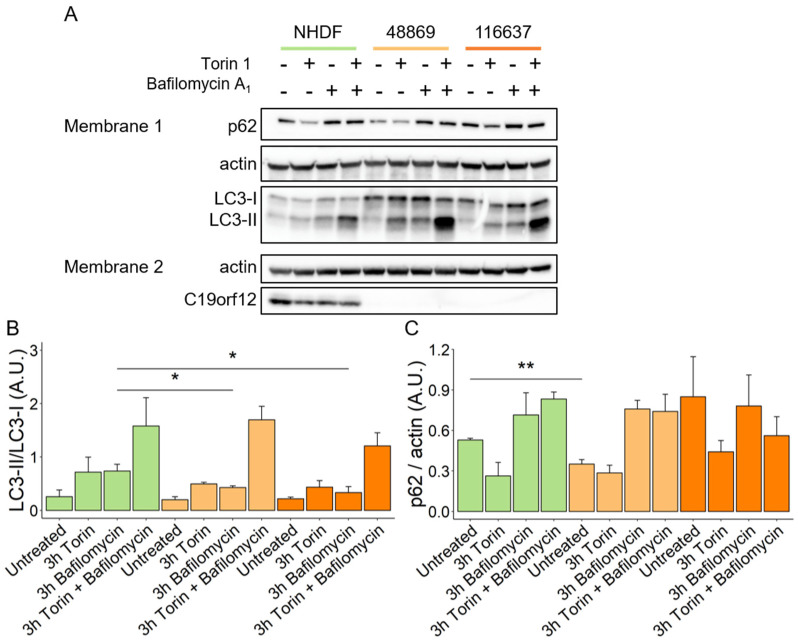
Autophagy flux in MPAN fibroblasts. Representative Western blot analysis of protein expression of LC3-I, LC3-II, p62, actin, and C19orf12 in control (NHDF), C19orf12D18G/L132Q (48869) and C19orf12G69Rfs*10/G69Rfs*10 (116637) fibroblasts upon treatment with 100 nM Torin, 100 nM Bafilomycin, and with 100 nM Torin plus 100 nM Bafilomycin Actin was used as a loading control. An amount of 16 μg of cellular lysate proteins were loaded in Membrane 1, and 10 µg in Membrane 2 (A). Relative abundance of LC3-II versus LC3-I (B). Quantification of p62 expression level relative to actin (C). Chemiluminescent protein signals were quantified using Fiji v. 2.3.0/1.53f n = 3 independent experiments were considered for the quantification. Data were analyzed with unpaired two-tailed t-test; * p < 0.05, ** p < 0.01.

